posts > security
Data Analysis for Cyber Security 101: Detecting Data Exfiltration

This is both a walkthrough of the solution of Wildcard 400 challenge in the recent 2019 Trend Micro CTF, and some notes on network security monitoring. I’d recommend you try out the challenges first here. All implementation of the solutions can be found this kernel.
Premise
You are a network security administrator for the medium sized business XYZcorp. You often use network flow data to uncover anomalous security events. This challenge provides some sample aggregated data on flows, and uses answers from the anomalous events to construct the flag.
Data here is synthetic and does not model typical network protocols and behaviour. So deep knowledge of network protocols is not needed for these challenges.
What are we trying to find?
All of the questions in this challenge are related to post-exploitation activities, which makes up the latter half of the cyber kill chain.
_
Modern approaches to cybersecurity do not stop in just trying to prevent exploitation. Exploitation is only the first step of the attack, and the end goal is typically* data theft.
*Except for attacks such as ransomware attacks
How do attackers get from an initial foothold to your data?
- To get the data, the attacker needs to exfiltrate the data
- To exfiltrate data, the attacker needs to reach the data (lateral movement)
- To move laterally, the attacker needs to coordinate with their foothold (Command and Control)
If we are able to detect and stop the attacker at any of these stages, then we can consider that as a win!
“Prevention is ideal, but detection is a must” — Dr. Eric Cole
Of course, this is a simplified version of a more complex chain of events. If you want to read up more on this you can look through the ATT&CK matrix
Data Exfiltration

Data exfiltration is a fancy way of saying data theft_._ At one point, the data has to flow from within your network to the hands of the attacker*.
*There are exceptions of course, such as exfiltrating the data physically
Blatant Exfiltration
Our intellectual property is leaving the building in large chunks. A machine inside is being used to send out all of our widget designs. One host is sending out much more data from the enterprise than the others. What is its IP?
Here we might assume that the attacker is not trying to hide. They try to transfer as much data as they can, without setting a limit to their data transfer. Let’s look at the hosts with the most outbound network traffic.
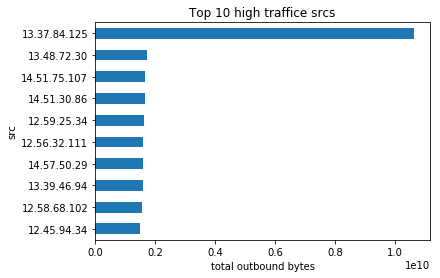 13.37.84.125 looks like a bad IP
We identify 13.37.84.125 as the bad IP, and looking at the distribution of the outbound of the traffic and see that this is atypical.
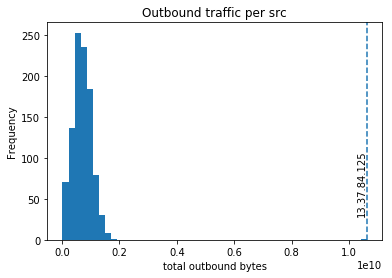 13.37.84.125 is clearly an outlier
This is the simplest alert you can make. Look at the daily distributions of your outbound traffic, and find a threshold to alert on. It would be embarrassing to discover a data breach 3 days after an attacker uploaded 50GB to Google Drive within an hour.
You might find outliers that are normal! Being an outlier is not necessarily synonymous with being malicious. You can find hosts that have extremely large outbound traffic compared to the rest of your network, only to discover that they are normal.
Let’s say your company uses a web proxy server, and requires HTTPS traffic to be proxied through this server. Then we would expect that this proxy server to have traffic several magnitudes larger than the rest of the network. The traffic we observe from it is the combined HTTPS traffic of hundreds of users.
In such a case, you should document these special servers, and analyse these separately. And while you’re at it, you might also want to check on the desktops that make or attempt to make direct outbound HTTPS traffic even if they do not consume high bandwidth, because they should pass through the proxy.
Off hours activity
Another attacker has a job scheduled that export the contents of our internal wiki. One host is sending out much more data during off hours from the enterprise than the others. What is its IP?
Typically, we should have some notion of business hours and off hours. For this challenge, we first have to infer what hours are business
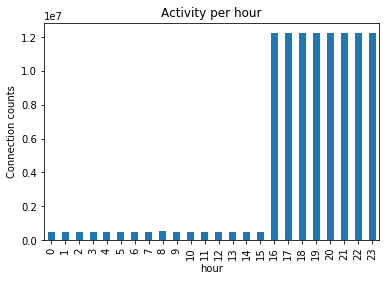 Office hours are between 16:00 to 23:00
Now that we have identified the business hours of the company, we filter our view only for traffic generated between 0:00 and 16:00 and see the hosts with the most outbound traffic during off-hours.
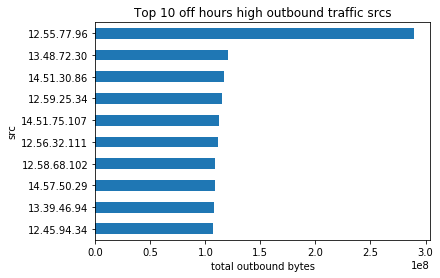 12.55.77.96 looks suspicious
This time, we see that 12.55.77.96 might be our bad IP. We look at the distribution of the total outbound traffic size during off hours, and we also see that this is an outlier.
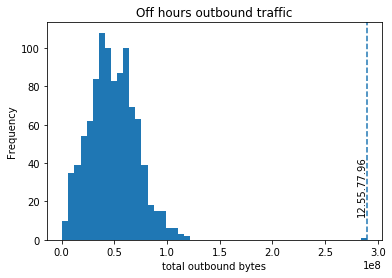 12.55.77.96 is an outlier
Looking only at off hour traffic is important because this might not be something that we would detect if we only looked at overall outbound traffic.
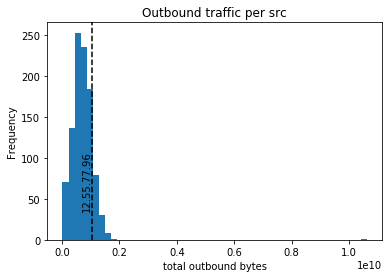 12.55.77.96 looks normal if we include traffic from “on” hours
It becomes apparent here that we should model “on” and “off” times separately. This is quite intuitive, the type of activities you expect to see during the day is different from those at night. This includes weekends and special holidays.
These off periods are also a good starting point for your baseline. You get an idea of the “background radiation” of your network.
Bad traffic that typically blends in during business hours, might stick out during off hours.
You might also find insider threats. “Remotely accesses the network while on vacation, sick or at odd times”, and “Works odd hours without authorization” are behavioural indicator of insider threats [1]. People are more sensitive to physical surveillance; they are more likely to try to do bad stuff when no one is around without realising that their actions are obvious at the network level.
Off-time is valuable. If I want to identify dial-homes, file exfiltration, and other suspicious activity, I like to do so by watching off-hours. There’s less traffic, there are fewer people… This is the reason I like to keep track of a company’s own special off-times. It’s easy enough for someone to hide his traffic by keeping all activity in 9–5/M–F, but if the attacker doesn’t know the company gives St. Swithin’s Day off, then he’s more likely to stick out.
— Michael Collins [2]
Although, if you go hunting, what you will find here are a lot of legitimate (maybe undocumented) business processes such as those that try to offload during the night to have minimal impact on business during the day. For example, you may discover that the database team has scheduled a weekly backup of your databases to your Amazon S3 bucket every 12 midnight. These are definitely things you should be able to detect.
Tunneling using common protocols
Some assailant is grabbing all the employee and vendor email addresses, and sending them out on a channel normally reserved for other uses. This is similar to attackers abusing DNS for data exfiltration. One host is sending out much more data on a some port from the enterprise than other hosts do. What is its port?
DNS tunneling is a technique used to exfiltrate data through features of the DNS protocol. If a host tries to exfiltrate data through DNS then we expect the number of requests to port 53 to be much larger than the other hosts which only use DNS to resolve the IP addresses of domains. So what we are looking for is traffic that is abnormal for that particular port.
We can actually use a similar approach to the previous sections, by looking at the top sources of traffic and seeing if they are outliers based on the port’s univariate distribution. However, this doesn’t scale well when you now have to look through many ports.
Let’s first look at several ports and we see that most of them are “nice” (maybe too nice), but have different means and variance.
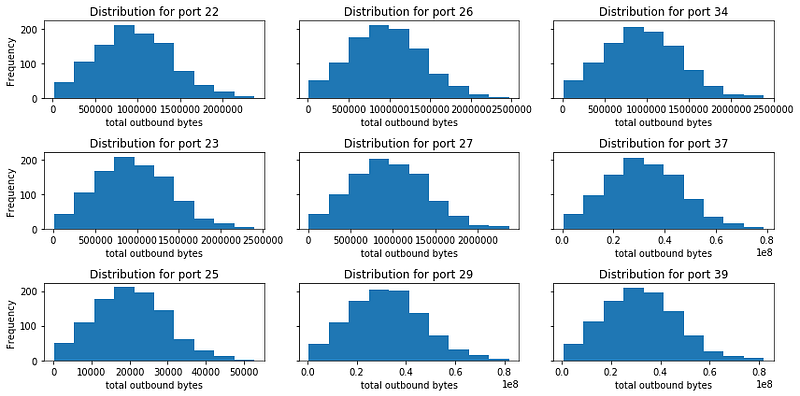 Note that these are from synthetic data
After looking some of the distributions, they look bell-shaped so using the Z-score might be appropriate. However, if you find that the distributions are highly skewed, then you might want to do transformations such as the log transformation, to make the distribution more bell-shaped.
For each port, we standardize the outbound traffic and get the top z-score for each port.
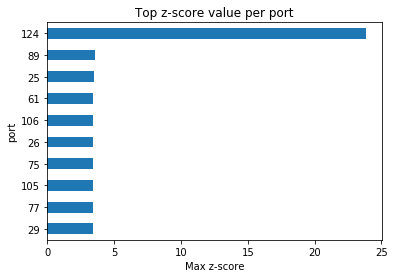 Clearly port 124 has the “most outlying outlier”
And investigating the distribution of port 124, we see that 12.30.96.87 looks like our bad IP.
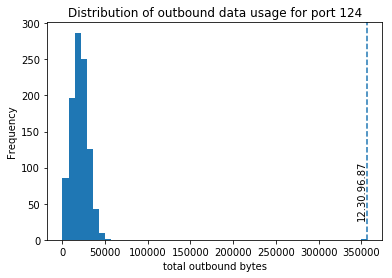
And if we look at the total outbound traffic for port 124 compared to other ports, we see that this is not something we can detect if we used a global threshold.
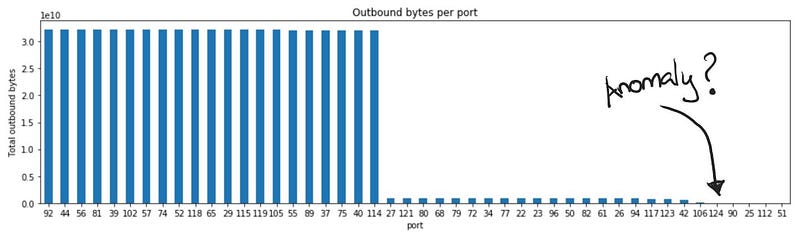 If looking at the long tail, then maybe
So how do we detect this? Similar to the previous section, there is a recurring theme: model different types of network activities separately. If you can identify distinct groups in the network traffic, then try to analyse them separately. It is easier to detect outliers if your data is identically distributed.
Also, we should also consider analyzing the long tail. If you see outbound traffic to ports that are not commonly used, then you should investigate what it is. Document it if it has legitimate use. Otherwise, you shouldn’t have allowed outbound connections to unknown ports in the first place.
However, for protocols such as DNS traffic, they are essential. So you’d find these ports are open outbound. Similar to a _web proxy, t_o make our lives easier, you should require all DNS queries to go through an internal DNS server, and block all outbound traffic on port 53 except for your internal DNS server. With logs from your DNS server, you get a wealth of information that makes detecting techniques like DNS tunneling easier. You do not have to limit your alerts on just frequency and connection sizes, since you can use the number of unique subdomains or the number of unique domains queried.
If you want to read more about DNS tunnelling you can read this blog from Akamai. Another similar and interesting way to tunnel is through ICMP.
Protect your data

It’s a little bit funny to think that by the time you detect data exfiltration in outbound network traffic, it may already too late! For us to detect high outbound traffic, the attacker has to have already stolen a lot of data first.
To mitigate this, you have to think about the data you actually care about:
- Where is the data?
- Who can access it?
- How can they access it?
Let’s say an attacker wants to exfiltrate 50GB of data from your SQL data base. He would first have to dump the tables of your SQL server to his host, and then upload these to some external cloud storage.
You could have detected the attacker even before he can exfiltrate the data if you were able to alert on either:
- Unauthorised SQL database dump
- Unusually high traffic transferred from the SQL server
For example, you look at what your SQL server typically does, and find out that the bulk of the SQL server’s traffic would typically with the web application server, some ETL processes and maybe some backup processes. Then high data transfer from SQL server to a SQL admin workstation may be considered abnormal.
Rather than monitoring all the traffic in your network to find “anything weird”, with a bit of analysis, you might be able to concentrate on a few components of your network.
Reducing the scope of some of your alerts to some key users or systems makes your models more efficient and you are able to detect subtler high-impact attacks.
Up next: Lateral Movement

In the next blog post, we will go through some of the questions on finding lateral movement.
The initial host that the attacker controls may not have access to the data that the attacker wants. The attacker then has to explore and navigate through the network, through different hosts and accounts until he reaches the final objective. This might be something we can detect given the right vantage points
References
[1] US-CERT, Combating the Insider Threat (2014)
[2] M. Collins, Network Security Through Data Analysis (2014)
[3] SEC511: Continuous Monitoring and Security Operations
Photos: Miguel Á. Padriñán from Pexels, , Josh Sorenson from Pexels, Skitterphoto from Pexels