posts > security
Data Analysis for Cyber Security 101: Detecting Lateral Movement

This is the second part of a series of blog posts. You can read the first one on Data Exfiltration.
This blog post is structured as follows:
- Introduction Lateral Movement (4 mins): a toy example to illustrate what lateral movement is
- Network Anomaly Detection (7 mins): Statistical and machine learning techniques to detect lateral movement
- CTF Challenges (3 mins): Solution to 3 CTF challenges on finding lateral movement
- Breach Reports (4 mins): Real-life examples and what we can learn from them
- Visibility and Sensor Vantage (3 mins): Checking the quality of your data and the extent of your visibility
- Dark Space and Honeypots (2 mins): Things to do to make it easier to detect lateral movement
Premise
Nice! You have successfully been able to detect and stop data exfiltration, but the battle is far from over. We still suspect that there are baddies lurking in your network. Being the responsible network security administrator that you are, you start hunting. Use network flow data to hunt for even more anomalous security events.
Presumption of compromise
A “healthy” mindset to have as a network security administrator is to presume that you have already been compromised, and with that, your objective is to find evidence of the adversary’s post-exploitation activities.
Remember, exploitation is just the first step for the attacker, and they still need to take additional steps to fulfill their primary object.

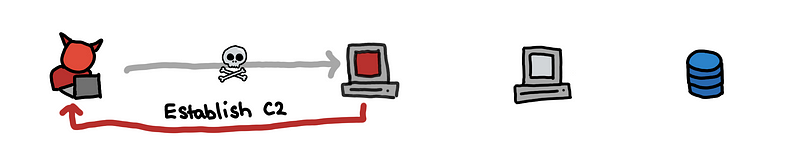
Recall from the previous blog post, after the initial compromise, in order to steal your data, the attacker needs to go through the following steps:
(1) The attacker needs to coordinate with their foothold using some command and control (C2) channel.
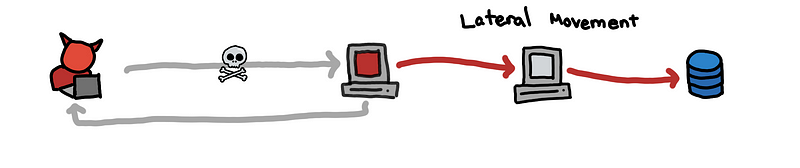
(2) Using the C2, the attacker needs to reach the data by navigating through the network and moving laterally.
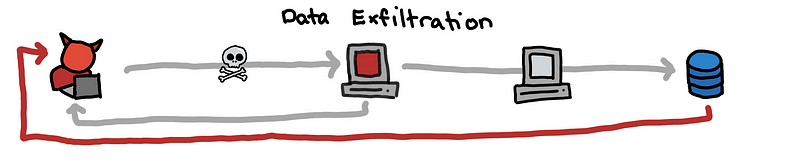
(3) Once the attacker has access to the data, the attacker needs to exfiltrate this data out of the network.
In this blog post, we will go through some simple ways of detecting lateral movement, and some notes on how we can design our systems to be defensible and monitorable so that we can continuously defend our network.
Lateral Movement

Toy Case Study
When the attacker successfully compromises a host, it is likely that the host doesn’t have the necessary credentials, privileges, and network access to get to the company’s secret data. In that case, the attacker has to utilize their existing foothold to gain higher-levels of access.
Before we go deeper into detecting lateral movement, let us use a toy case study so that we can “picture” what is really going on.
We have two main departments in our network:
- HR Department: Opens a lot of random emails from job applicants. They only have access to the internal email server.
- IT Group: Manages production databases and employee desktops
HR employees are an easier target for the bad guy, but, even if an HR employee is tricked into opening a malicious PDF that gives the attacker access to an HR machine, this access won’t immediately give him access to the production data. So what now?
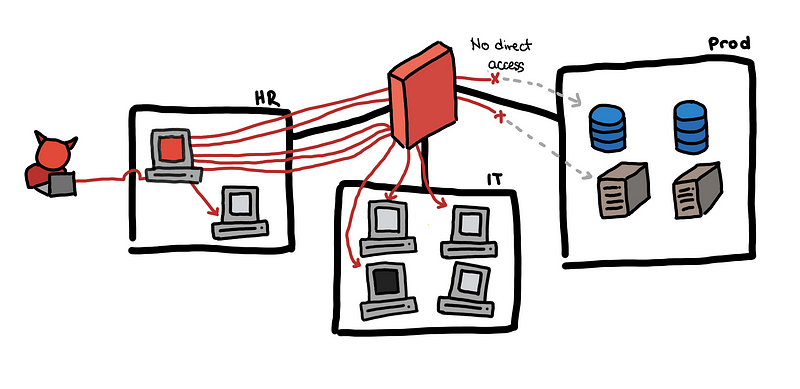
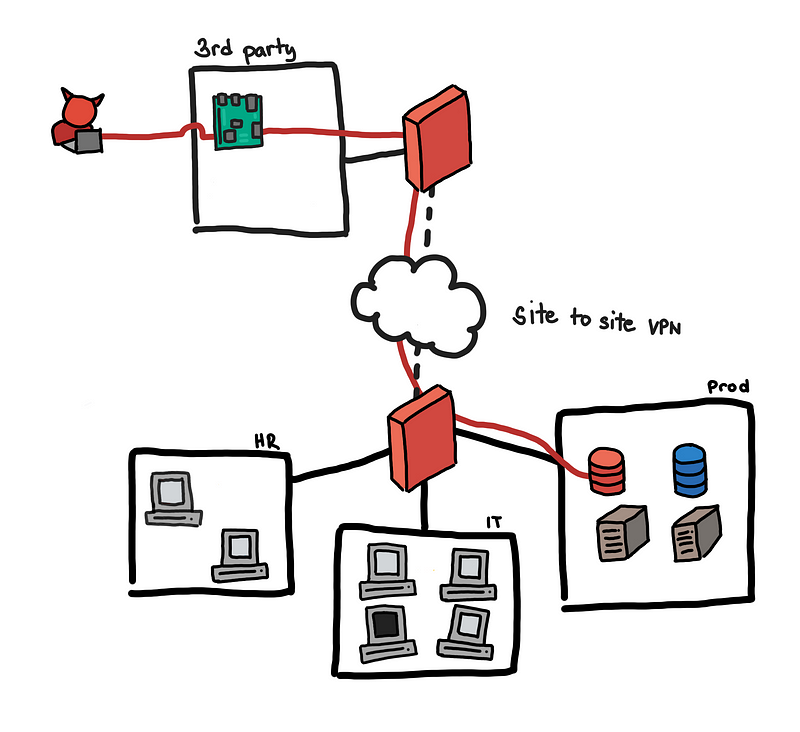
Below we illustrate our toy case study and how an attacker might be able to pivot internally to be able to eventually gain access to the production data.
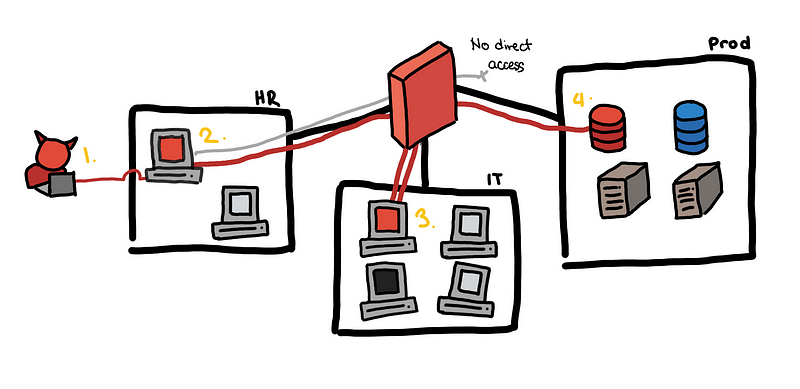 Toy example, from an email to the production database
- The attacker sends a fake job application email and HR opens the attached CV. This turns out to be a malicious PDF, which helps the attacker establish a foothold in the HR subnet using a reverse shell.
- With brute force, the attacker gets the local administrator credentials of the HR machine and is able to escalate his privilege.
- Unfortunately, all machines have the same local administrator credentials. Using these credentials, he is able to pivot to a host in the IT group subnet.
- Tunneling through the IT group host, he is able to access all production servers.
How do we detect this lateral movement? There are some things that the diagram above does not show. Think about how the attacker is able to discover the different accounts, hosts, and services that he used to pivot.
Host Discovery [1]
 “What can I access using this HR machine?”
Between step 2 and step 3 above, the bad guy has to somehow know what IP address in the IT subnet he can pivot to. How did he find this IP?
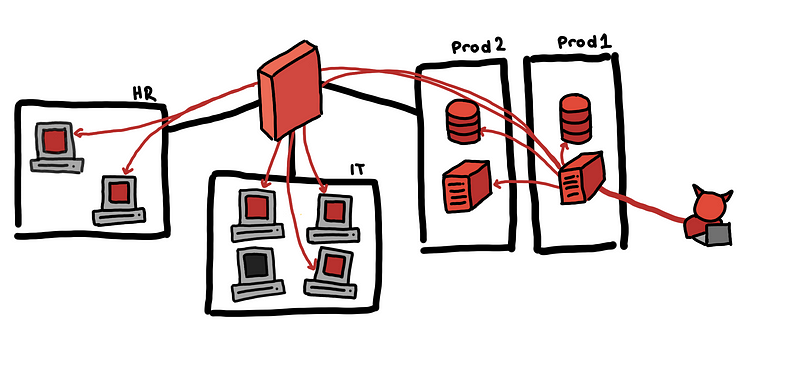
One way to do this is by scanning for accessible IP’s doing a network scan. If the scan ends up enumerating all the hosts in a subnet, this can be noisy and easy to detect.
A telltale sign of this is a single source host attempting to establish connections to numerous destination hosts. This is in TCP, UDP, and ICMP.
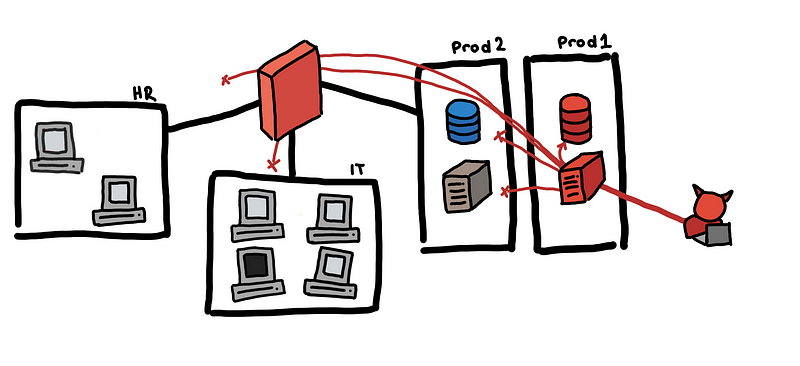
Also notice that when scanning for accessible hosts, some connections might not be allowed by the firewall. If your firewall logs these dropped attempts, then this will give us another way of detecting network scanning. Another red flag is when the firewall drops a lot of different connections from a single source host.
In some cases, having a single dropped connection is also a red flag especially if the network is set up well. For example, if a production web server tries to connect to an internal host and this gets dropped by a firewall rule, something weird might be happening.
Service Discovery [2]
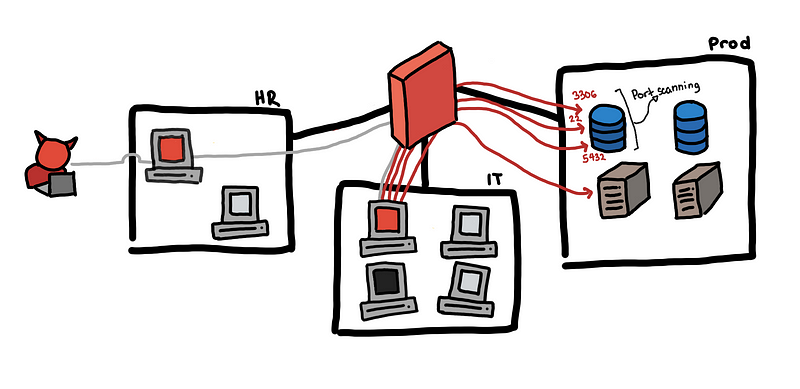 “Is this a database? Or is it a web server?”
Now that the attacker knows which hosts he can reach, the next question might be, what services do they have? Between steps 3 and 4, the attacker could have first discovered that there is a service running on port 5432 that is why he figured it was probably a PostgreSQL server.
Discovering exposed running services involve trying to find the host’s open ports through a port scan. This can be very noisy as well depending on the attacker’s objective.
By default, nmap scans 1000 “interesting” ports [3] of each protocol. However, the attacker might opt to scan all 65535 ports which would be even noisier. Or the attacker might be more covert by opting to scan only a few ports he cares about such as ports 139 and 445 for NetBIOS service scanning.
For the more covert port scanning, this is closer to looking for signs of host scanning.
For the noisy port scanning, we are looking for sources that try to connect to a lot of destination ports. Relevant logs are network flow logs or firewall logs.
If you set up alerts for this, the first things you should find are your vulnerability scanners. If you don’t find these, then you are doing something wrong.
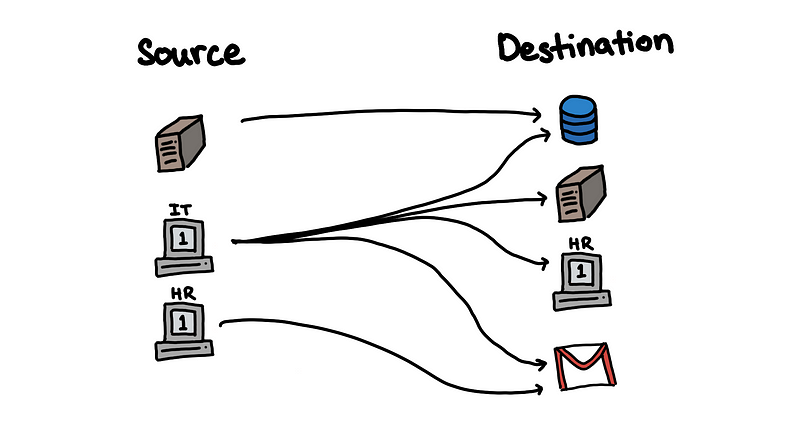
Endpoint to endpoint connections
The most common connections that you should see in your network are from an endpoint to a server or a server to another server. It shouldn’t be common to see endpoints talk to one another, and even more uncommon to see connections from server to an endpoint. (This especially if you do not expect employees to create their own file shares.)
An example where endpoint to endpoint connection is benign is a connection from IT to different hosts on the net. This might be for maintenance or updates.
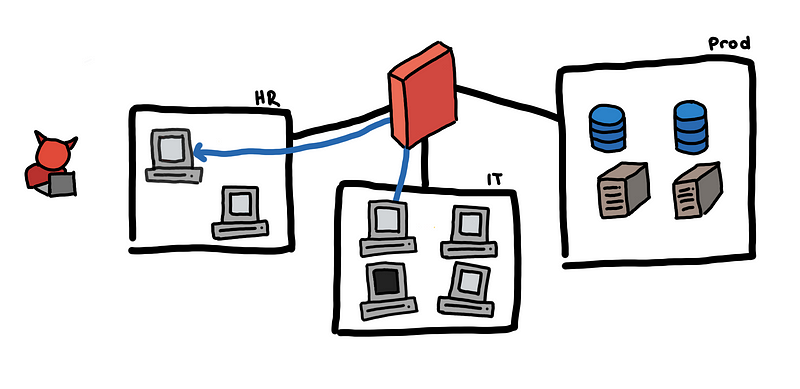 IT machine talking to HR machine might be normal
However, an HR machine establishing a connection directly to an IT machine is probably not normal.
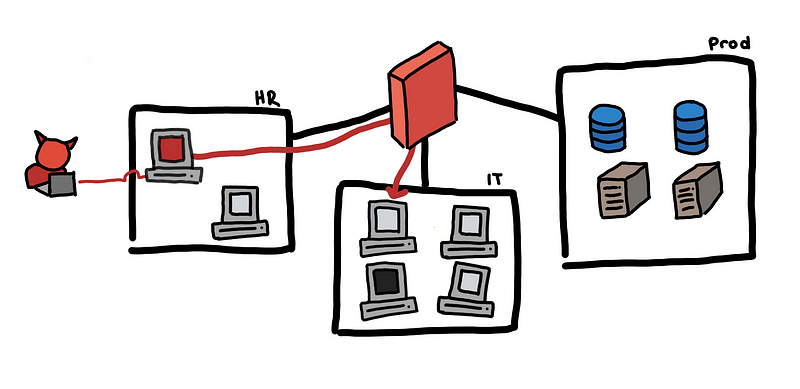 HR machine connecting to an IT machine is probably not normal
The more “intimately” you know your network, the more you can narrow down the types of connections that might be anomalous, and which of those really matter.
In the toy example, we can set-up an alert for any connection attempt from an HR machine to any other host except for the email server. We can even block any connection of HR to any internal host except for the email server.
Network Anomaly Detection

The methods we’ve discussed so far are signature-based. Based on our identified mechanisms of how lateral movement might happen, we define business rules and encode them as alerts. With these, we are able to incorporate as much domain expertise and context to our alerts. Done properly, these provide us with alerts with a good signal-to-noise ratio.
Although these type of rules are necessary to defend our network, they may not be sufficient to properly defend our networks because:
- The complexity of the network scales much faster than the security team’s added manpower
- Enterprise networks are not static, and continuous monitoring and re-baselining is needed
- Business rules are not robust in detecting novel attacks
If your network is relatively small, then you can survive with rule-based alerts, because you can probably describe all normal connections that you expect to see and create an alert for those that you don’t consider normal. These hosts should only talk to the DNS, and Proxy server. This server should only connect to this database. Only these particular hosts should connect to the production databases…
However, as your network grows larger, complexity increases, it becomes almost impossible to keep track of all these. That is why we want to explore some techniques for network anomaly detection.
The hypothesis is that a malicious host would deviate from the typical behavior. If we are somehow able to capture the characteristics of “normal” in an automated way, then hopefully we are able to catch malicious activities by sifting through the “abnormal”.
Good ways to define and model “normal” is an area of on-going research. For this blog post, we will look mainly at two approaches:
- Finding outliers in hosts’ behavioral signatures.
- Finding unexpected connections through new edge/link prediction
Outliers in Host Behavioral Signatures
The idea here is to summarize the behavior of hosts for a given time interval into a single vector. With these all of the host vectors, we can identify hosts who seem out of place with the rest of the network.
Feature Engineering
The first most important step is to build features for each host in the network.
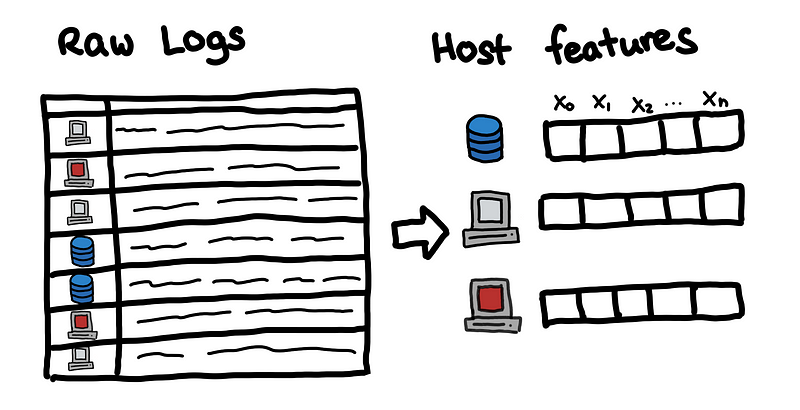
What features should we get? Well, it depends on what is available to you and what the security domain experts of your organization advise.
As a starting point, we look at what features the paper [13] used. They used a total of 23 features:
- RDP Features: SuccessfulLogonRDPPortCount, UnsuccessfulLogonRDPPortCount, RDPOutboundSuccessfulCount, RDPOutboundFailedCount, RDPInboundCount
- SQL Features: UnsuccessfulLogonSQLPortCount, SQLOutboundSuccessfulCount, SQLOutboundFailedCount, SQLInboundCount
- Successful Logon Features: SuccessfulLogonTypeInteractiveCount, SuccessfulLogonTypeNetworkCount, SuccessfulLogonTypeUnlockCount, SuccessfulLogonTypeRemoteInteractiveCount, SuccessfulLogonTypeOtherCount
- Unsuccessful Logon Features: UnsuccessfulLogonTypeInteractiveCount, UnsuccessfulLogonTypeNetworkCount, UnsuccessfulLogonTypeUnlockCount, UnsuccessfulLogonTypeRemoteInteractiveCount, UnsuccessfulLogonTypeOtherCount
- Others: NtlmCount, DistinctSourceIPCount, DistinctDestinationIPCount
Other examples of features from [14] are:
- Whether at least one address verification failed over the last 24 hours
- The maximum outlier score given to an IP address from which the user has accessed the website
- The minimum time from login to checkout
- The number of different locations from which a user has accessed the website over the last 24 hours.
With these feature vectors, we can build a matrix and start using outlier detection techniques.
Principal component analysis
We start with a classical way of finding outliers using principal component analysis (PCA) [15] because it is the most visual, in my opinion.
In simple terms, you can think of PCA is a way to compress and decompress data, where the data lost during compression in minimized.
Since most of the data should be normal, then the low-rank approximation from PCA would focus on normal data. How does PCA perform with outliers?
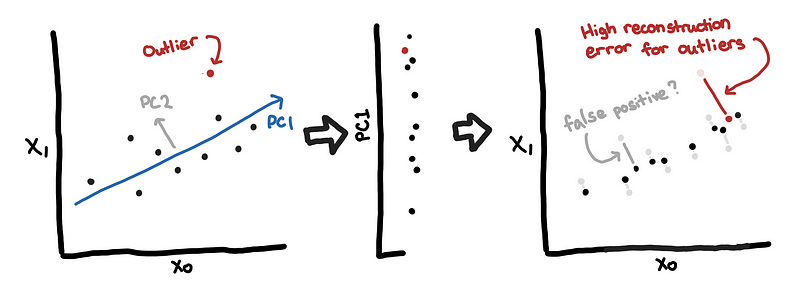
Since the outliers do not conform to the correlation structure of the rest of the data, these would have high reconstruction errors. One way to visualize this is to think of the “normal data” as the background activity of the network.
Below we see a more visual example from the numerical linear algebra course of fast.ai [12]. They constructed a matrix from the different frames of the video. The image on the left is one frame of the video. The image in the middle is the low-rank approximation using Robust PCA. The image on the right is the difference, the reconstruction error.
 [12]](https://cdn-images-1.medium.com/max/800/1*cJiQBgyNv7dX47YXFEGiaw.png) Example background Removal with Robust PCA lesson from fast.ai [12]
Example background Removal with Robust PCA lesson from fast.ai [12]
In the example above, the “subjects” of the video typically appear in the reconstruction error. Similarly, we are hoping that anomalous hosts would stand out from the background and have high reconstruction errors.
Note: Classical PCA can be sensitive to outliers (unfortunately), so it might be better to use Robust PCA discussed in [12]
Autoencoders
I won’t go into much detail on Autoencoders, but you can think of autoencoders as a non-linear version of PCA.
The neural network is constructed such that there is an information bottleneck in the middle. By forcing the network to go through a small number of nodes in the middle, it forces the network to prioritize the most meaningful latent variables, which is like the principal components in PCA.
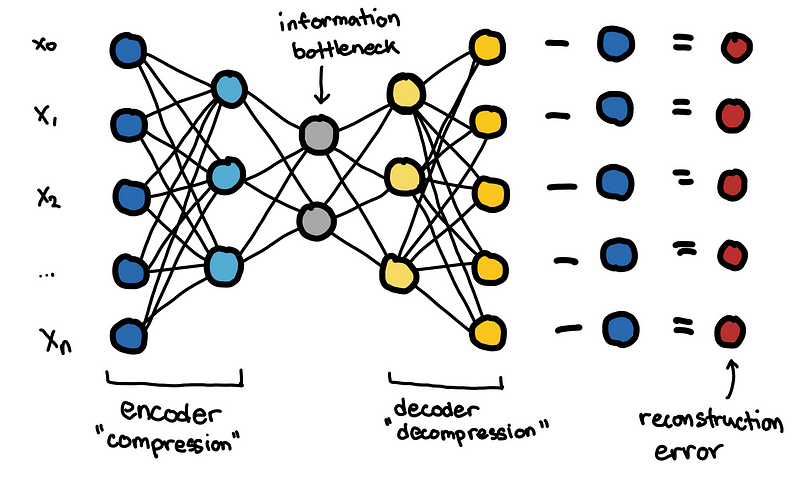
Similar to the PCA, if the autoencoder is trained on normal data, then it can have a hard to reconstructing the outlier data. The reconstruction error can be used as an “anomaly score”.
PCA and autoencoder are some of the components used by [14] for detecting malicious hosts in an unsupervised manner.
Isolation forests and other methods
Another popular way to find anomalous hosts is by using isolation forests, which has been shown to this performed better than other methods [13]. Just like many tree-based algorithms, this can handle both numerical and categorical data and there are few assumptions on the distribution and shape of the data.
In the end, we want to use our historical data to learn a function that can aid us in distinguishing what is normal and not normal.
OD [16]](https://cdn-images-1.medium.com/max/800/1*ygP_zmnI7GU6oDs_uXQeRg.png) Example decision boundaries learned from different methods using PyOD [16]
Example decision boundaries learned from different methods using PyOD [16]
If you want to explore different methods for outlier detection, I recommend going through PyOD [16] and go through the implemented algorithms and the papers that they cite.
If you are interested in learning more about this I would recommend watching Anomaly Detection: Algorithms, Explanations, Applications [17].
New Edge/Link Prediction
This is an oversimplification of [11]
Unlike the previous methods, where we try to find malicious hosts. Here, we try to find anomalous edges, where an edge is a connection between a client and a server, or source and destination. The source/client can also be usernames and the edges represent authentication.

Now suppose this the first time we are seeing this edge. We might ask, what is the probability of observing this new edge?

For the function above, we need to have some sort of representation for both the client and the server. We can have categorical covariates for example:
- The subnet of the host
- The type of host (endpoint or server)
- Job title of the user
- Location of the user
With categorical covariates, represented by a binary indicator variable, we can use the interactions of the source and destination to get an idea of how likely the new edge is.
Getting embeddings for source and destination
One other way to represent a host is to generate some sort of embeddings.
Let us say from the historical data, we have previously observed the following edges. A host can be both a source in some connections and a destination in some other connection.
From this, we can construct an adjacency matrix, where each cell represents a possible edge, and edges that have been observed have a value of 1.
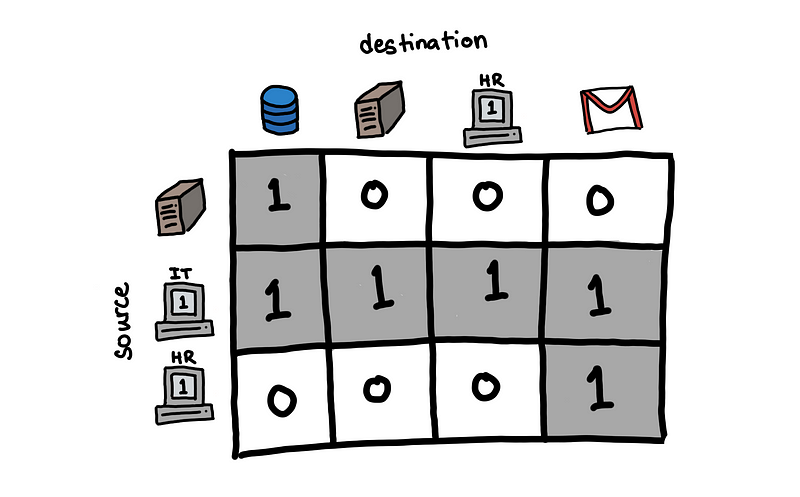 Adjacency matrix from previous example
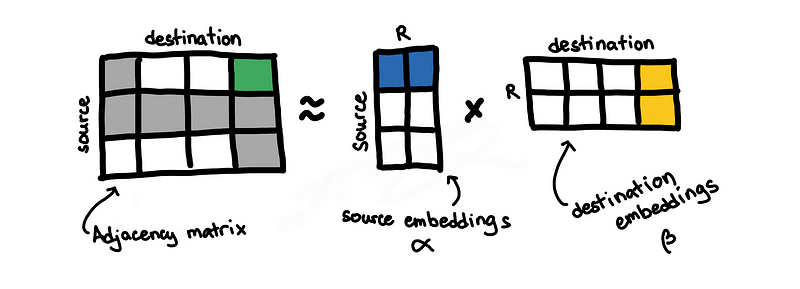
Using this matrix, we can perform some non-negative matrix factorization. This is something that we see in other applications such as recommender systems and collaborative filtering. Through the factorization, we are able to get embeddings for both source and destination.
Link prediction
The paper [18] shows how to be able to the factorization while incorporating the categorical covariates. This is done through Poisson Matrix Factorization (PMF).
After estimating the embeddings and some necessary coefficients , we can estimate how likely observing new edges are.
![[Probability function under the PMF model [18]](https://arxiv.org/pdf/2001.09456.pdf)](https://cdn-images-1.medium.com/max/800/1*1JcfVSheWpV4QfPl8gHudg.png) Probability function under the PMF model [18]
Probability function under the PMF model [18]
I hope you get a high-level idea of what we’re trying to do, but of course, estimating the values for α,β, and ɸ in a computationally efficient way is the crux of the problem. Details can be seen [18] and there are. Another paper that is also on edge prediction is [11].
If you are interested in more applications of statistics in cyber security I suggest watching Nick Heard’s talk Data Science in Cyber-Security and Related Statistical Challenges [19].
CTF Challenges

The following is a(very late) partial walkthrough of Wildcard 400 challenge in the 2019 Trend Micro CTF specific to lateral movement. Try out the challenges here, and solutions can be found in this kernel.
Data here is synthetic and does not model typical network protocols and behavior. So deep knowledge of network protocols is not needed for these challenges.
Lateral Brute
Question 9: Once a machine is popped, it’s often used to explore what else can be reached. One host is being used to loudly probe the entire enterprise, trying to find ways onto every other host in the enterprise. What is its IP?
We see that the host is scanning the entire network. This probably means that we are looking for signs of host scanning.
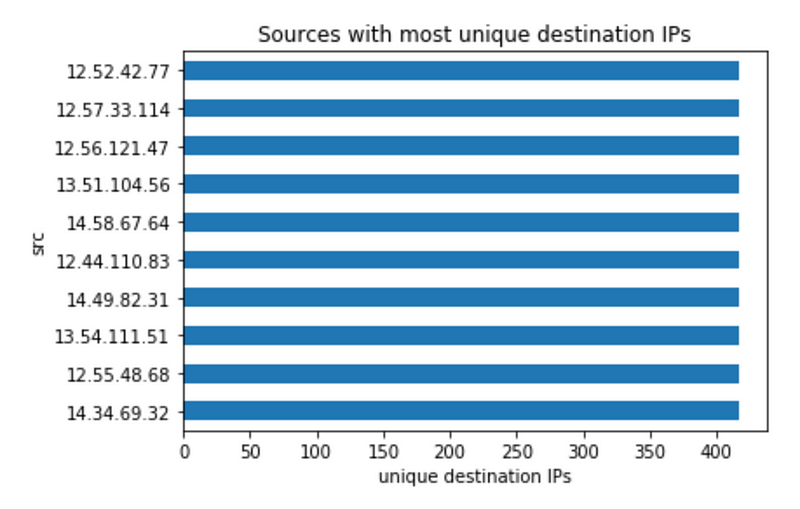
To do this we get the source IP addresses that have a lot of unique destination IPs.
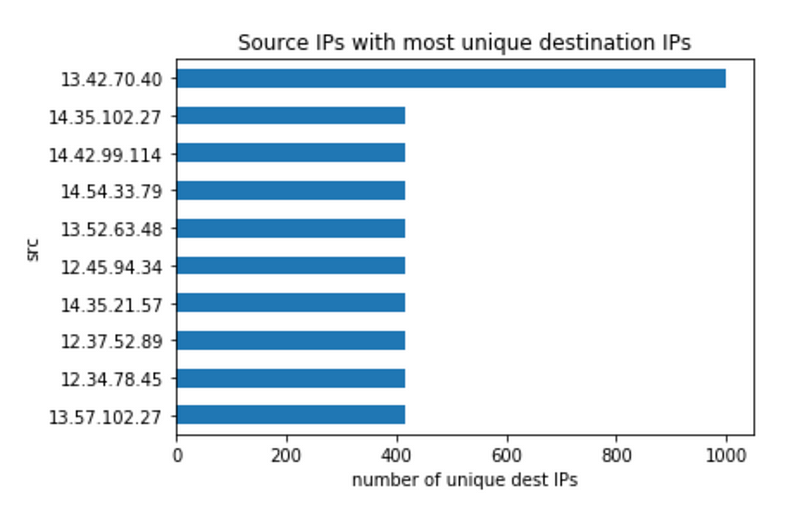
Here it is clear that 13.42.70.40 is scanning and trying to move laterally. For completeness, we look at its network activities and see a spike in network activity due to scanning on off-hours.
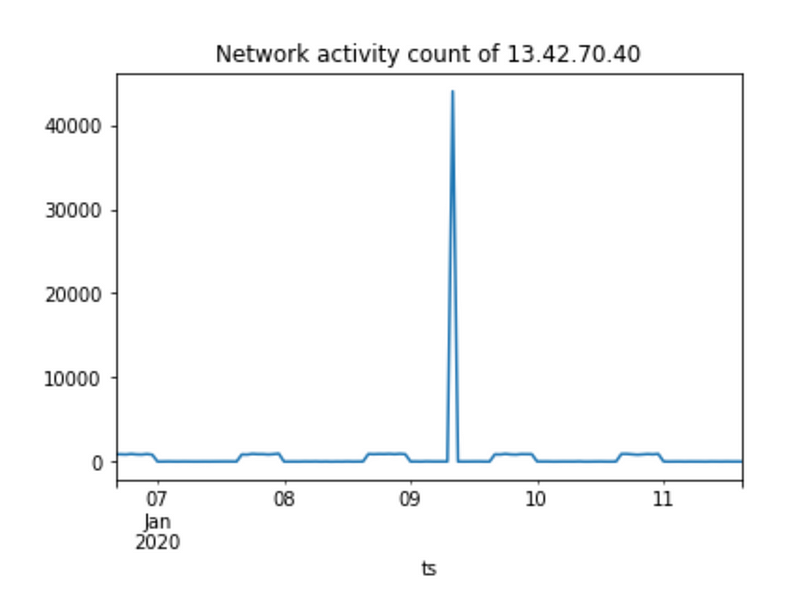
Scanning that is not throttled is very noisy and generates a lot of traffic. So if the attacker doesn’t try to be covert with their network scanning, this is something we expect to see.
Lateral Spy
Question 10: One host is trying to find a way onto every other host more quietly. What is its IP?
This is a trickier question. After excluding 13.42.70.40, it is hard to find any other host that stands out in terms of count of unique destination IPs or destination ports.
Thus, the following plots are useless. The bad host is blending in with the background activities of normal hosts.
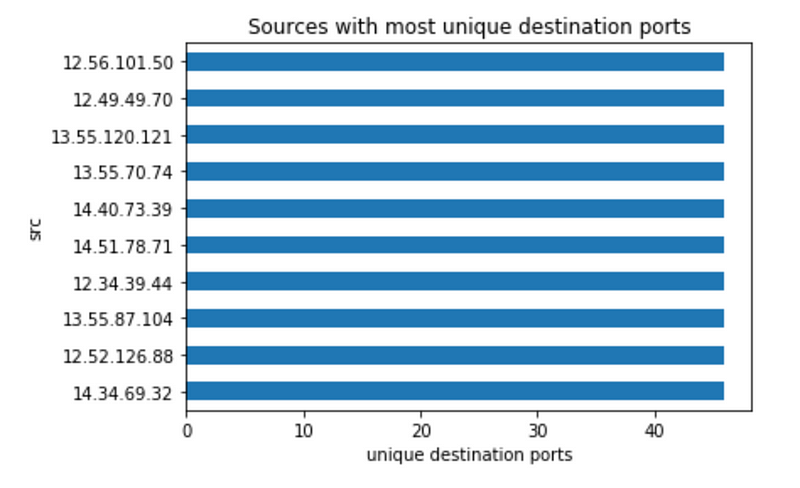
We have to find a more creative way to find the scanning activity. If we had more context of the network, then we can focus on:
- connection to ports that are not used in the network
- connections to endpoints
This is something that we know from baselining our network, but we did not have that kind of context in our network. To infer what ports were “normal”, we assumed that if multiple source hosts connected to a particular IP address and port, then it is probably normal.
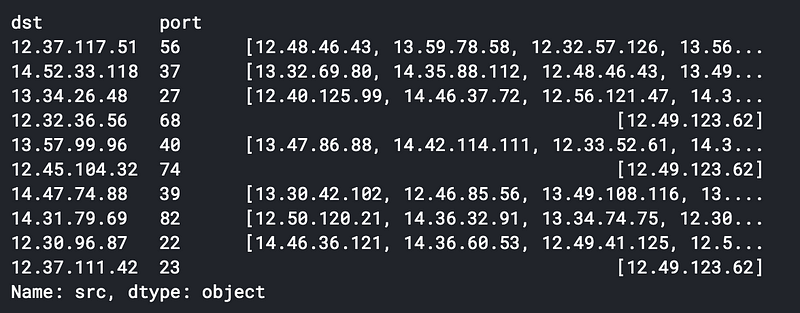 List of source IPs for a given destination IP and port
For example, we see multiple hosts connect to 12.37.117.51:56 then this is probably a normal connection.
For 12.32.36.56:68 , we see that only 12.49.123.62 attempted to connect to it. This is probably abnormal.
After filtering out the normal destination IP and ports, the only source host left is 12.49.123.62 . This is our bad IP.
Bonus (Optional): Internal P2P
Question 5: Sometimes our low-grade infection is visible in other ways. One particular virus has spread through a number of machines, which now are used to relay commands to each other. The malware has created an internal P2P network. What unique port is used by the largest internal clique, of all hosts talking to each other?
This is related to detecting lateral movement but the solution involves using analysis techniques from graph theory.
This problem is pretty straightforward since the question directly asks for the largest clique. A clique is a set of hosts that all have connections to one another.
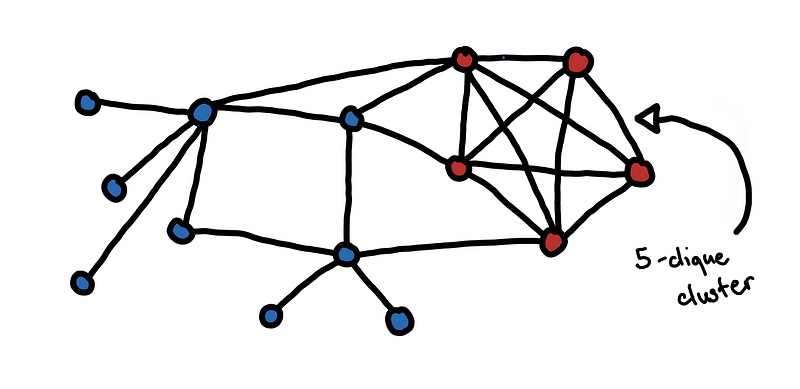 Each circle is a host in the network. If two hosts have a connection with each other, we put an end between them.
Using NetworkX, we can get the exact answer by enumerating all cliques and finding the largest one. However, this does not scale well.
We opt to use the fast approximate method large_clique_size(G).
G = networkx.Graph()
G.add_nodes_from(internal_nodes)
for l, r **in** zip(internal_edges.src, internal_edges.dst):
    G.add_edge(l, r)

_size = large_clique_size(G)
With the code above we can get the large cliques for a particular port but this is too slow to run for all ports. To speed up the search, we filter out the ports where the maximal clique is guaranteed to be small.
It is easy to show that if a clique of size K exists inside graph G, then there should exist at least K nodes in G with degree greater than or equal to K-1. Given this fact, we can compute an upper bound for the clique size for each port. The code to do this is in the solutions kernel.
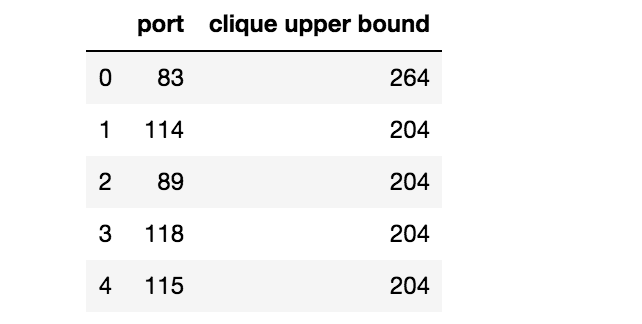 These are ports with the highest upper bounds
Processing these ports we find that port 83 has a maximal clique of 264.
Breach Reports

In this section, we will go through historical “shipwrecks” from previous data breaches.
2018 SingHealth Data Breach [5]
The 2018 SingHealth data breach had data of 1.5 million patients of the Singapore Health Services was stolen. This incident is closest to our toy case study.
![An illustrated summary of key events from the SingHealth Data Breach Incident Report [5]](https://cdn-images-1.medium.com/max/800/1*xur_GMN4dKfVZYeTBmtOuA.png) An illustrated summary of key events from the SingHealth Data Breach Incident Report [5]
An illustrated summary of key events from the SingHealth Data Breach Incident Report [5]
Briefly, the key events are:
- Although it is not clear in the report exactly how it happened, we know that the attacker was able to install malware on Workstation A through a phishing attack.
- Using access to Workstation A, the attacker was able to compromise multiple endpoints and servers. According to the report, the attacker is likely to have compromised the Windows authentication system and obtained administrator and user credentials from the domain controllers.
- Eventually, the attacker was able to control Workstation B, which was a workstation that had access to the SCM application. With it, the attacker was able to find the proper credentials to compromise the SCM system
- Ran numerous queries on SCM database
- Exfiltrated the data through Workstation A
Here are some of the contributing factors that were identified in the report.
Network connections between the SGH Citrix servers and the SCM database were allowed.
The network connections between Citrix server farm to the SCM database server were allowed. A basic security review of the network architecture could have shown that this open network connection created a security vulnerability.
Had the two systems been isolated, the attacker would not have been able to access the SCM database as easily.
Based on the report, one of the reasons for keeping this open network connection between the two systems is for operational efficiency. The administrators wanted to be able to use the Citrix Server and the tools installed there to manage the multiple databases of the different systems.
SGH Citrix servers were not adequately secured against unauthorized access
A lot of the factors here are related to authentication and credential management, which is beyond the scope of this blog post. One that is relevant to us now is, Lack of firewalls to prevent unauthorized remote access using RDP to the SGH Citrix servers.
2018 NASA JPL Breach [6]
The 2018 NASA JPL breach was famous for having the headline of “NASA hacked because of unauthorized raspberry pi”. The final report does not go into a lot of detail on what the initial point of entry was, how exactly did the attacker gain access to the raspberry pi, and where the raspberry pi is situated.
What I find interesting is the finding “Inadequate Segmentation of Network Environment Shared with External Partners”.
 3rd party access to the internal network should be restricted
JPL established a network gateway to allow external users and its partners, including foreign space agencies, contractors, and educational institutions, remote access to a shared environment for specific missions and data. However, JPL did not properly segregate individual partner environments to limit users only to those systems and applications for which they had approved access… The cyberattacker from the April 2018 incident exploited the JPL network’s lack of segmentation to move between various systems connected to the gateway, including multiple JPL mission operations and the DSN.
Lateral movement can result to access across organizations. Enforce a strict trust boundary for external parties, and make sure to restrict their access to your network to only the essential connections. External parties may not have security posture as your organization and might be the weak link. Make sure to fine-tune your IDS or IPS to treat traffic from these subnets as external.
2017 Equifax Data Breach [7]
The 2017 Equifax breach is a data breach resulted in leakage of the data of approximately 143 million U.S. consumers.
The point of entry was the ACIS application which was not patched for the now-famous critical Apache Struts vulnerability. Using this vulnerability, the attackers were able to get a web shell on the server and run arbitrary commands.
Given that the ACIS server was compromised, it would have been ideal that the impact of the attack is isolated to the ACIS system alone. Attempts to access resources outside would be blocked by either the network or host firewall.
 Network segmentation limits the blast radius
Unfortunately, according to the report, the Equifax network was flat! This is the worst-case scenario because a compromise of any host can lead to the compromise of any host in the network.
 Flat networks make attacks very efficient
Security Concern 1. There is no segmentation between the Sun application servers and the rest of the [Equifax] network. An attacker that gains control of the application server from the internet can pivot to any other device, database, or server within the [Equifax] network, globally… If an attacker breaches the network perimeter of an organization with a flat, unsegmented network, they can move laterally throughout the network and gain access to critical systems or valuable data.
With remote access to the ACIS web server, the attackers were able to:
- Mount a file share containing unencrypted application credentials
- Run 9,000 queries on 51 different databases.
- Exfiltrate all the data
To put it into context, the ACIS only used 3 databases but had network access to 48 unrelated databases. Had the ACIS system been isolated to only the relevant databases, then the breach wouldn’t have been as bad.
Network Segmentation
A common theme that we see across all the different breaches is that network segmentation plays a big role in preventing lateral movement.
If the network is properly segmented, the blast radius is limited to the specific system, and the attacker will have a harder time navigating across the network.
However, for traditional networks, very granular segmentation might be too cost-prohibitive and you might be restricted by the physical topology of the network. But for cloud deployments, because everything is virtualized and can be automated, we can apply micro-segmentation to our systems [4]. You can isolate machines on a per-workload basis as opposed to a per-network basis.
Visibility and Sensor Vantage

One critical activity you’d want to do before even setting up alerts and rules is to check what logs are you actually collecting. It has to be clear to you and your team what the limits of your visibility are.
- What data sources do I collect logs from?
- What kinds of logs do I have enabled in each data source?
- What does my data source/sensor actually “see”?
- Have I tested it?
What data sources do I collect logs from?
Check what data sources you collect from.
For traditional on-premises, you can just list down all the usual stuff from your appliances and vendors, DNS, DHCP, Active Directory, Firewall, Proxy, SQL, etc. You can also check Security Onion. It’s free and you are able to leverage the knowledge and the tools of the community that have grown around it.
For cloud deployment, make sure you are collecting the audit and access logs of the critical services that you use in your cloud provider. Also, collect network flow logs.
What kinds of logs do I have enabled in each data source?
Some data sources do not save all the necessary logs by default and you would need to turn it on.
You might find that some firewall rules are not logged because of a misconfiguration. “I turned off all the logging of X because it was filling up the disk.”
In Google Cloud Platform, for example, firewall logs, VPC flow logs, and GCS Data Access logs are not turned on by default.
What does my data source/sensor actually “see”?
A sensor’s vantage describes the packets that a sensor will be able to observe. Vantage is determined by an interaction between the sensor’s placement and the routing infrastructure of a network [8].
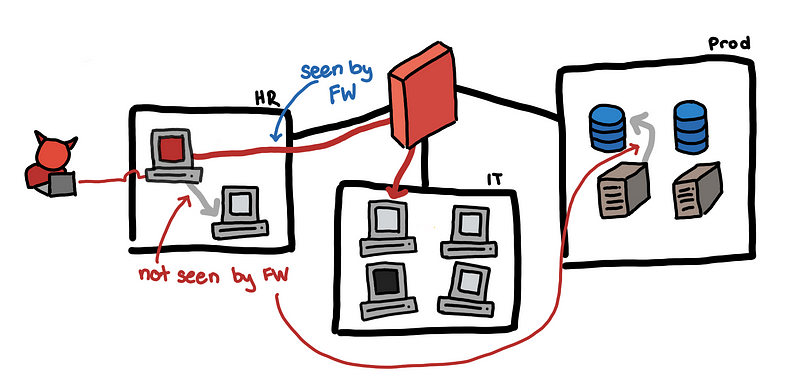 Not all connections are visible to our sensor
For our toy use case, it may be the case that connections within the same subnet won’t need to pass through the firewall. If we analyze our firewall logs, the only connections that we see are from hosts in two different subnets.
Some enterprises may have separate appliances for the perimeter firewall and the internal firewall. Let’s say you are only collecting logs from the perimeter firewall, then it is likely that any internal to internal connections would not appear on your SIEM.
Be careful with this. You have to know where your blind spots are. Using logs that do not give you sufficient visibility on your network can give you a false sense of security. You might think that no one is scanning the network, when in fact, there is and you just don’t see it!
For cloud infrastructures, it depends on what your cloud service providers give you. Since everything is virtualized, you are no longer restricted by the physical topology of your network, and there is a potential having uniform visibility across the IaaS. But if you are using PaaS, and especially for SaaS, you have less control over what kind of logs you get.
Have I tested it?
The only way to be sure that your data sources are working and you are getting the logs is to test it!
Formulate several simple scenarios from your threat modeling and simulate it. Try to actually run a network scan on different subnets or try to use certain honey credentials. See if these will generate the logs and alerts you want. See if your new machine learning model will detect this.
When you are running simulations you are able to test your detection systems from end to end, from log collection, data transformations, ingestion of SIEM, rules and alerts, and perhaps even investigation and incident response.
It will also give you the chance to catch instances where your data sources are failing or were misconfigured. Maybe the service died, its storage got filled up or its license expired. Maybe a change in the firewall configuration inadvertently disabled logging for a set of firewall rules.
Do not think that everything is okay just because you are not receiving alerts from your NIDS or DLP; What if the NIDS host was accidentally turned off 3 months ago?
Equifax did not see the data exfiltration because the device used to monitor ACIS network traffic had been inactive for 19 months due to an expired security certificate. [7]
Test, test, test!
Dark Space and Honeypots

Here are some things that might be useful for those who have more mature networks and security posture.
Dark space
An unused address or port number is called dark space, and legitimate users rarely try to access dark space. Most users do not enter IP addresses manually and often rely on DNS or applications to connect for them. Attackers, on the other, will likely end up accessing them when trying to move laterally [8].
We can alert on internal hosts that try to access these dark spaces. This can be noisy, but can be easy to investigate in some cases. One common reason for the alert is misaddressing or misconfiguration.
According to [8], here are some things you can do to make it more likely that the attacker would access dark spaces, making it a bit easier to detect:
- Rearrange addresses: Most scanning is linear/sequential, and rearranging addresses so that they’re scattered evenly across the network, or leaving large empty gaps in the network is a simple method that creates dark space.
- Move targets: If the port assigned to a service is non-standard, the attacker will find it only after enumerating a lot more ports, making them more visible. Of course, there is a trade-off with since changing the ports around too much might confuse everyone.
Honey Things
Honey things are similar to dark spaces in which we don’t expect these things to come up in our logs.
Unlike dark spaces, these things do exist in our network, but they do not have any legitimate use. Regular employees do not know about these and should not ever need to use or access these. An attacker, on the other hand, might encounter these while they are moving about the network, and if these honey things look valuable or useful, they might try to do something with them.
Examples of these are:
- Honey credentials:
- Honey tokens
- Honey file shares
- Honey servers
We want them to look valuable, and once any of these come up in our logs, we investigate. Tim Medin discusses this in more detail in his recent webcast “Dirty Defense, Done Dirt Cheap: Make Your Life Easier By Making Mine Harder” [9].
Others
This is related but I will just mention this very briefly (because this blog post is already long enough, sorry).
Although NIDS and NIPS, are sometimes deployed at the perimeter. If properly positioned and configured, they can help detect lateral movement. It would be able to detect client-side exploits over the network, possible file transfers, and usage of uncommon unauthorized network protocols. You can also use NIDS to detect honey tokens when they are transferred in plaintext over the wire.
Check that it is configured to ignore internal to internal connections.
Up Next: Command and Control, Beaconing

We’ve barely scratched the surface. You can dive deeper with logs such as Active Directory to be more precise in your search for lateral movement, but we have to move on for now.
In the next blog post, we will go through some of the questions on finding evidence of command and control.
The attacker needs to be able to establish control over their foothold to navigate through your network. As they say, to kill a snake cut off its head.
References
[1] Nmap Reference Guide, Chapter 15, Host Discovery.
[2] Nmap Reference Guide, Chapter 15, Service and Version Detection.
[3] Daniel Miessler, SecLists.
[4] CSA Security Guidance (v4), 7.3.3 Microsegmentation and the Software Defined Perimeter.
[5] Public Report of the COI into the Cyber Attack on Singapore Health Services Database.
[6] Cybersecurity Management and Oversight at the Jet Propulsion Laboratory.
[8] M. Collins, Network Security Through Data Analysis (2014)
[9] Dirty Defense, Done Dirt Cheap: Make Your Life Easier By Making Mine Harder.
[10] Security Onion.
[12] Rachel Thomas, Fast.ai Numerical Linear Algebra, Lesson 3: Background Removal with Robust PCA.
[14] Veeramachaneni, Kalyan, et al. “AI^ 2: training a big data machine to defend.”
[15] Mei-ling Shyu, et al. A novel anomaly detection scheme based on principal component classifier.
[16] PyOD: A Python Toolbox for Scalable Outlier Detection.
[17] Thoman Dietterich. Anomaly Detection: Algorithms, Explanations, Applications.
[19] Nick Heard. Data Science in Cyber-Security and Related Statistical Challenges
Photos by Artem Saranin from Pexels, Denis Yudin from Pexels, Ignacio Palés from Pexels, Tom Swinnen from Pexels, Igor Goryachev on Unsplash, Eleonora Patricola on Unsplash, Ammie Ngo on Unsplash