posts > stats
A gentle introduction to HDBSCAN and density-based clustering
Explaining density based clustering in ~5-minutes
“Hierarchical Density-based Spatial Clustering of Applications with Noise” (What a mouthful…), HDBSCAN, is one of my go-to clustering algorithms. It’s a method that I feel everyone should include in their data science toolbox .
I’ve written about this in my previous blog post, where I try to explain HDBSCAN in as much depth as I could. This time I am taking the opposite approach: I will try to explain the main ideas HDBSCAN and density-based clustering as succinctly as I can.
I think (and I hope) that this primer on HDBSCAN would be friendlier for beginners and new-comers in data science
Why density-based clustering?
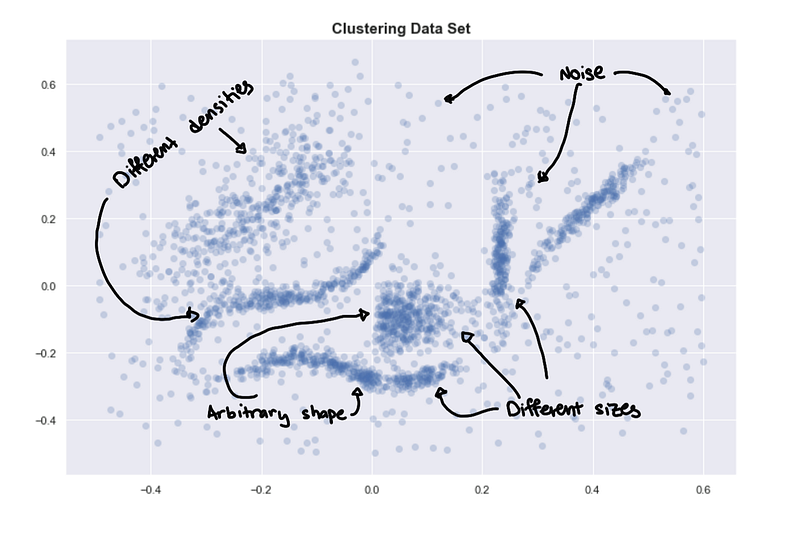
Let’s start with a sample data set.
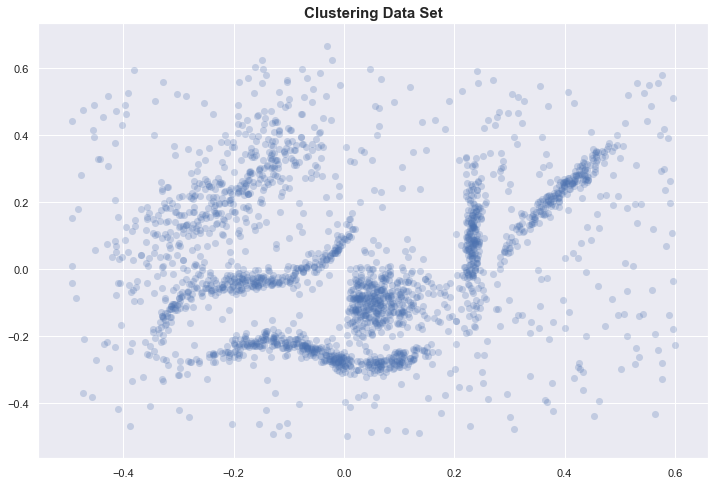
If you visually try to identify the clusters, you might identify 6 clusters.
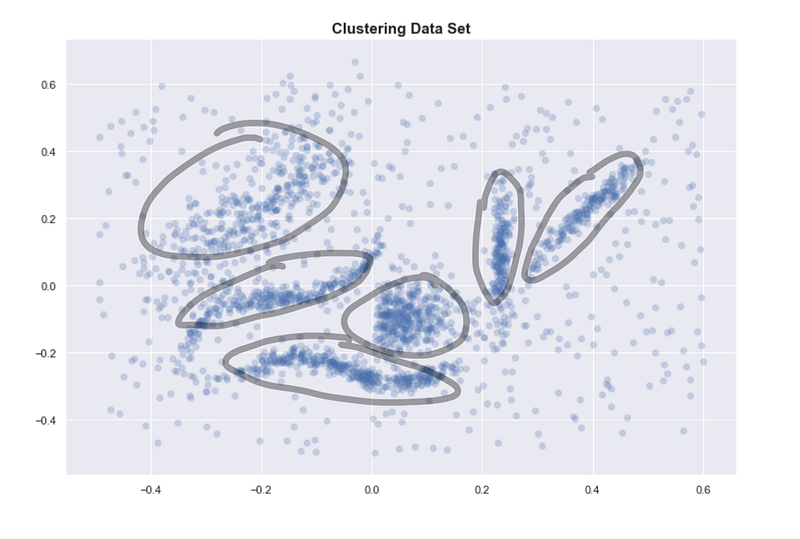 6 “intuitive” clusters
Even when provided with the correct number of clusters, K-means clearly gives bad results. Some of the clusters we identified above are separated into two or more clusters. HDBSCAN, on the other hand, gives us the expected clusters.
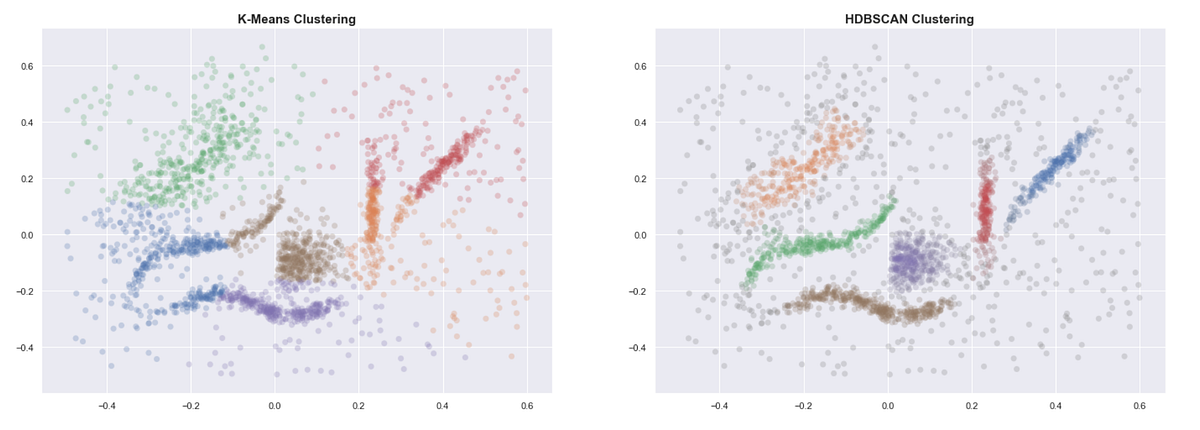
Unlike K-means, density-based methods work well even when the data isn’t clean and the clusters are weirdly shaped.
How does HDBSCAN do this? At a high level, we can simplify the process of density-based clustering into these steps:
- Estimate the densities
- Pick regions of high density
- Combine points in these selected regions
Estimating densities
We need some method to estimate the density around certain points. One common way to do this is by using “core distance.” This is the distance of a point to its K-th nearest neighbor.
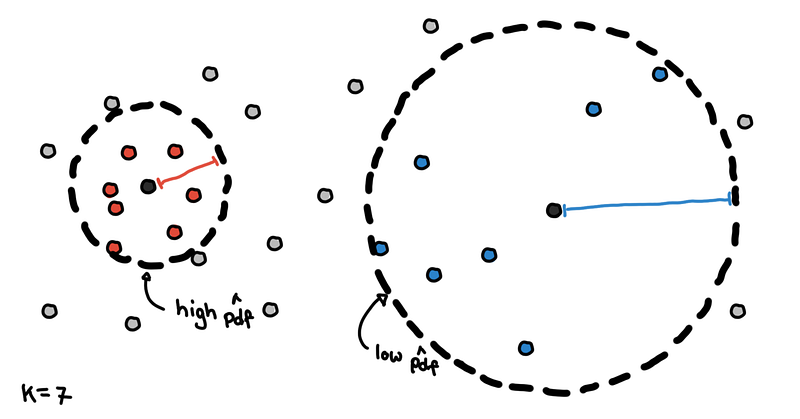 Core distance with K=7
Points in denser regions would have smaller core distances while points in sparser regions would have larger core distances. Core distance is what makes these methods “density-based”.
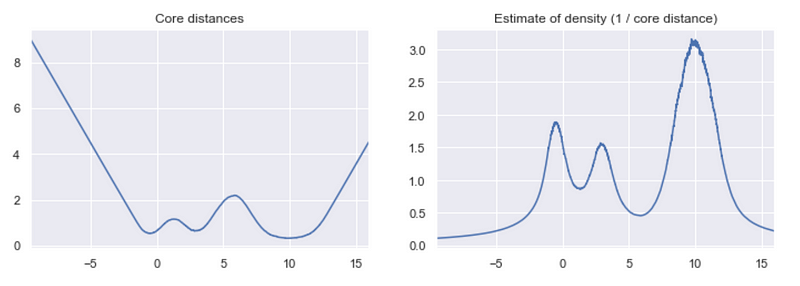
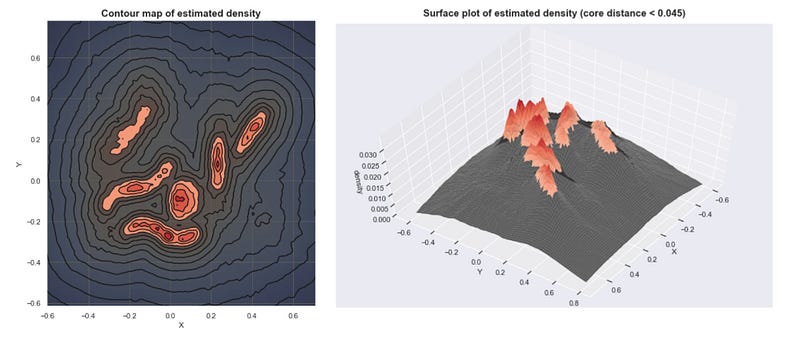
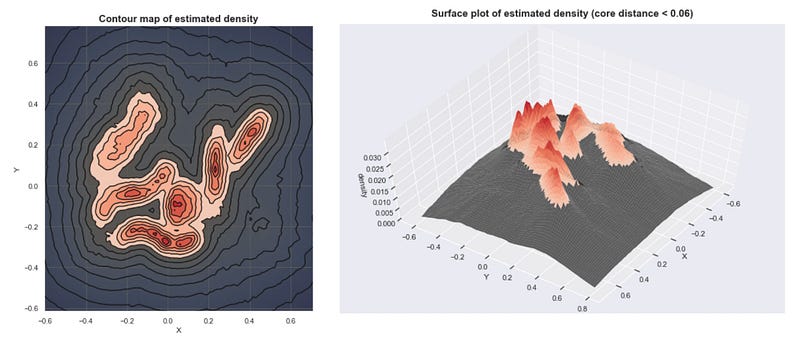
Given the core distances, we can derive an estimate of the density by getting the inverse of it. With these estimates, we can get an idea of what the density landscape looks like.
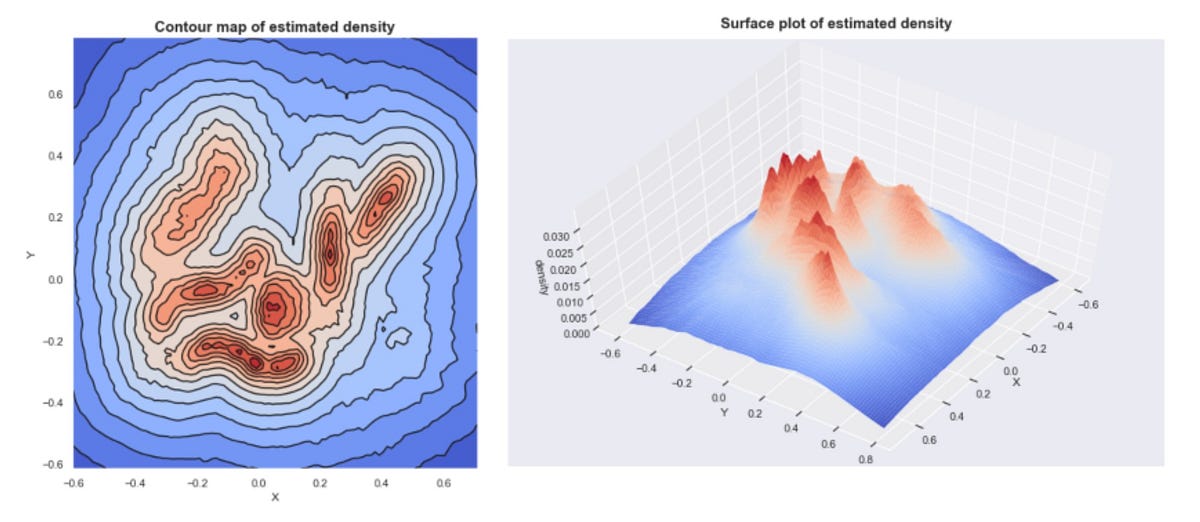 Estimated densities from our sample data set
If we plot these densities, we can see that the mountains of this density landscape correspond to the different clusters of the data.
Simple Cluster Selection
One way to select clusters is to pick a global threshold. By getting the points with densities above the threshold, and grouping these points together, we get our clusters.
Think of this illustration below as a cross-section of the surface plot above.
 Two different clusterings based on different thresholds
Imagine islands on the ocean, where the sea level is the threshold and the different islands are your clusters. The land below the sea level is noise. As the sea level goes down, new islands appear and some islands combine to form bigger islands.
Here are several clusters that result as we lower the sea level. (With K=30)
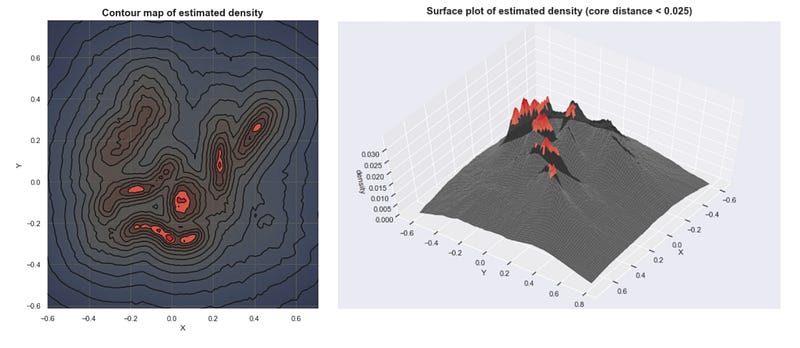
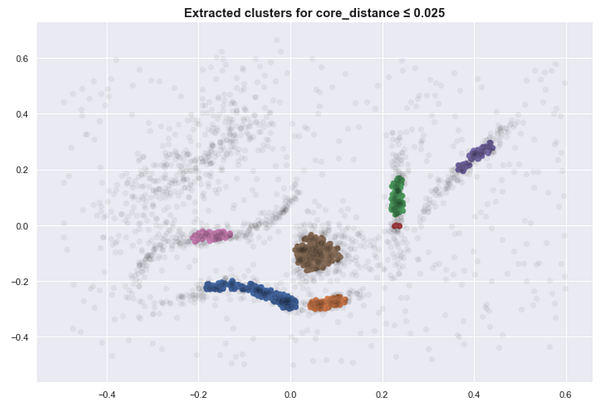

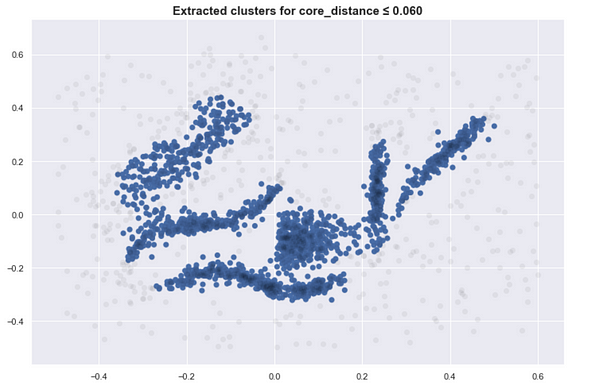
This approach is close to what DBSCAN does. Although simple, this requires us to find the proper threshold to get meaningful clusters.
If you set the threshold too high, too many points are considered noise and you have under grouping. If you set it too low, you might over group the points, and everything is just one cluster.
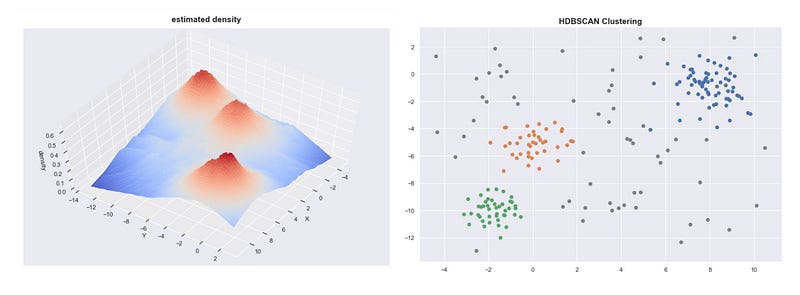
Cluster Selection for varying densities
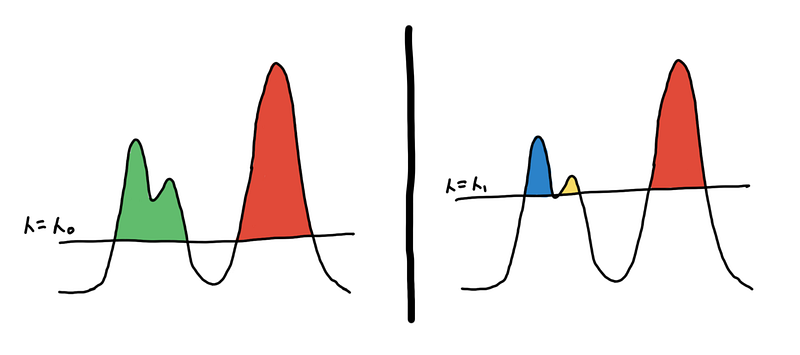
With the global threshold method, you might have a hard time when the clusters have varying densities. If we use just one threshold in the example below, we either over-group the blue and yellow clusters or we fail to include the entire red cluster.
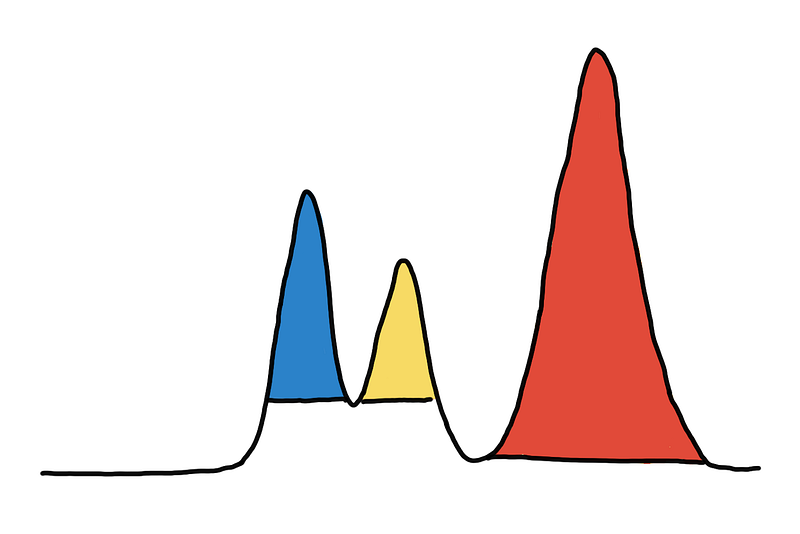 Optimal clustering requires different thresholds
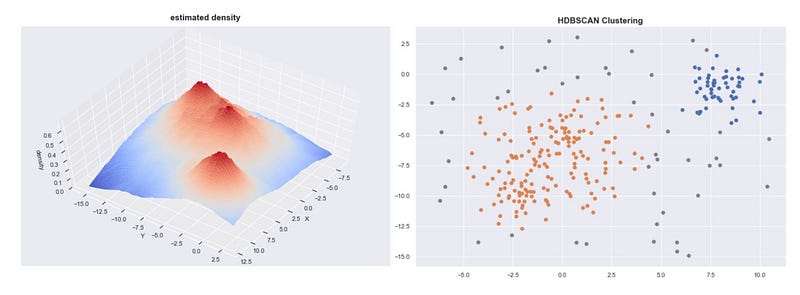
You might be tempted to think that each peak in the density should be one cluster, however, this will not always be optimal.
Look at the image below. On the left, there should be 3 clusters, and on the right, there should be 2 clusters.
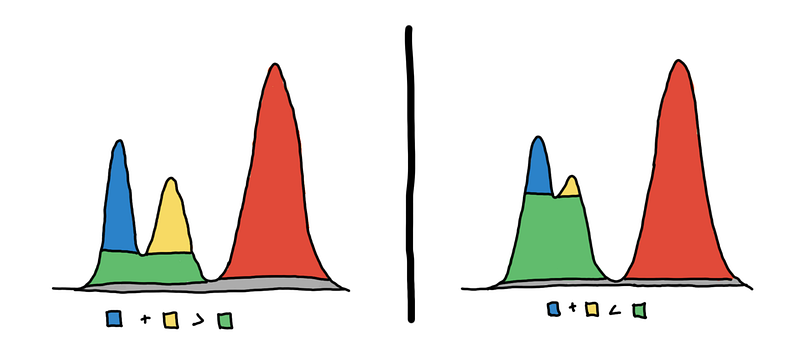
HDBSCAN first builds a hierarchy to figure out which peaks end up merging together and in what order, and then for each cluster it asks, is it better to keep this cluster or split it up into its subclusters? In the image above, should we pick the blue and yellow regions or the green region only?
Given the density landscape, you can think of each mountain is one cluster. We have to decide whether or not two peaks are part of the same mountain. Are there two mountains, or just one mountain with two peaks?
Below are examples that illustrate this point
 “3 cluster data set”
 “2 cluster data set”
If you use the sklearn’s HDBSCAN, you can plot the cluster hierarchy.
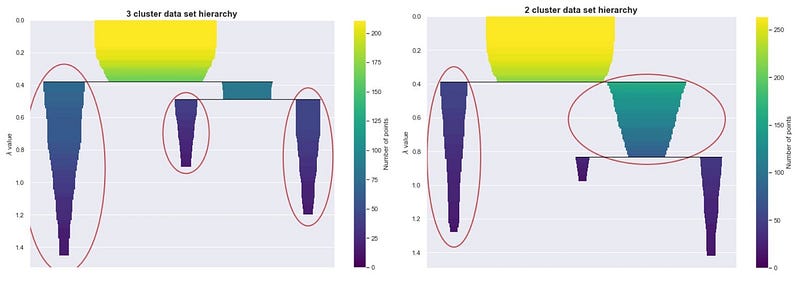
To choose, we look at which one “persists” more. Do we see the peaks more together or apart? Cluster stability (persistence) is represented by the areas of the different colored regions in the hierarchy plot. We use cluster stability to answer our mountain question.
When the two peaks are actually two mountains, the sum of the volume of the two peaks is larger than the volume of their base. When the peaks are just features of a single mountain, then the volume of the base would be larger than the sum of the peaks’ volume.
Using this heuristic, HDBSCAN is able to decide whether or not to subdivide a cluster to its subclusters. By doing so, it automatically chooses which clusters to extract.
Conclusion and further resources
- We estimate densities based on core distances and form the density landscape (what makes these density-based)
- We can use a global threshold to set the sea level at and identify the islands (DBSCAN)
- We can try to decide, are these several mountains or one mountain with multiple peaks? (HDBSCAN)
I hope this gives you the gist how DBSCAN/HDBSCAN works and what makes these methods “density based”. Other methods such as OPTICS or DeBaCl use similar concepts but differ in the way they choose the regions.
If you want to know more about the statistical motivation for HDBSCAN, implementation details of how points are combined together, or how HDBSCAN builds the hierarchy you can check out blog post where I go into much more detail.
Technical Note: The estimated densities plotted here isn’t just 1 / core_distance. I had to apply some transformation to the data to make it more visually appealing.
Understanding HDBSCAN and Density-Based Clustering pberba.github.io
How HDBSCAN Works - hdbscan 0.8.1 documentation hdbscan.readthedocs.io